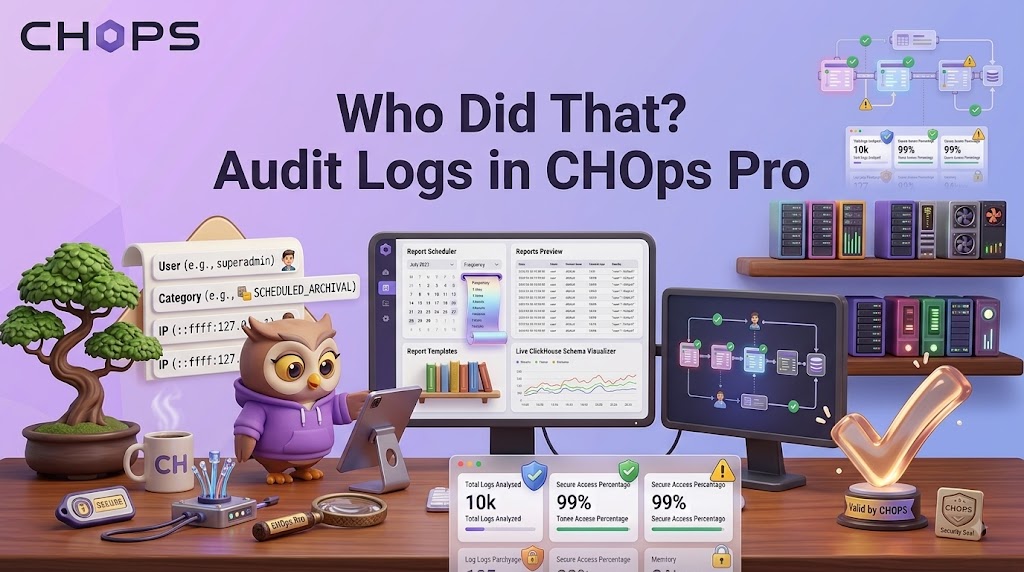
Audit logs answer one of the most important questions in a shared ClickHouse® cluster: who did that? When a setting changes, a table disappears, or a node is restarted, CHOps Pro records who performed the action, what they changed, when and where it happened, and whether it succeeded.
If nobody wrote it down, the answer is guesswork. That is the gap an audit log closes.
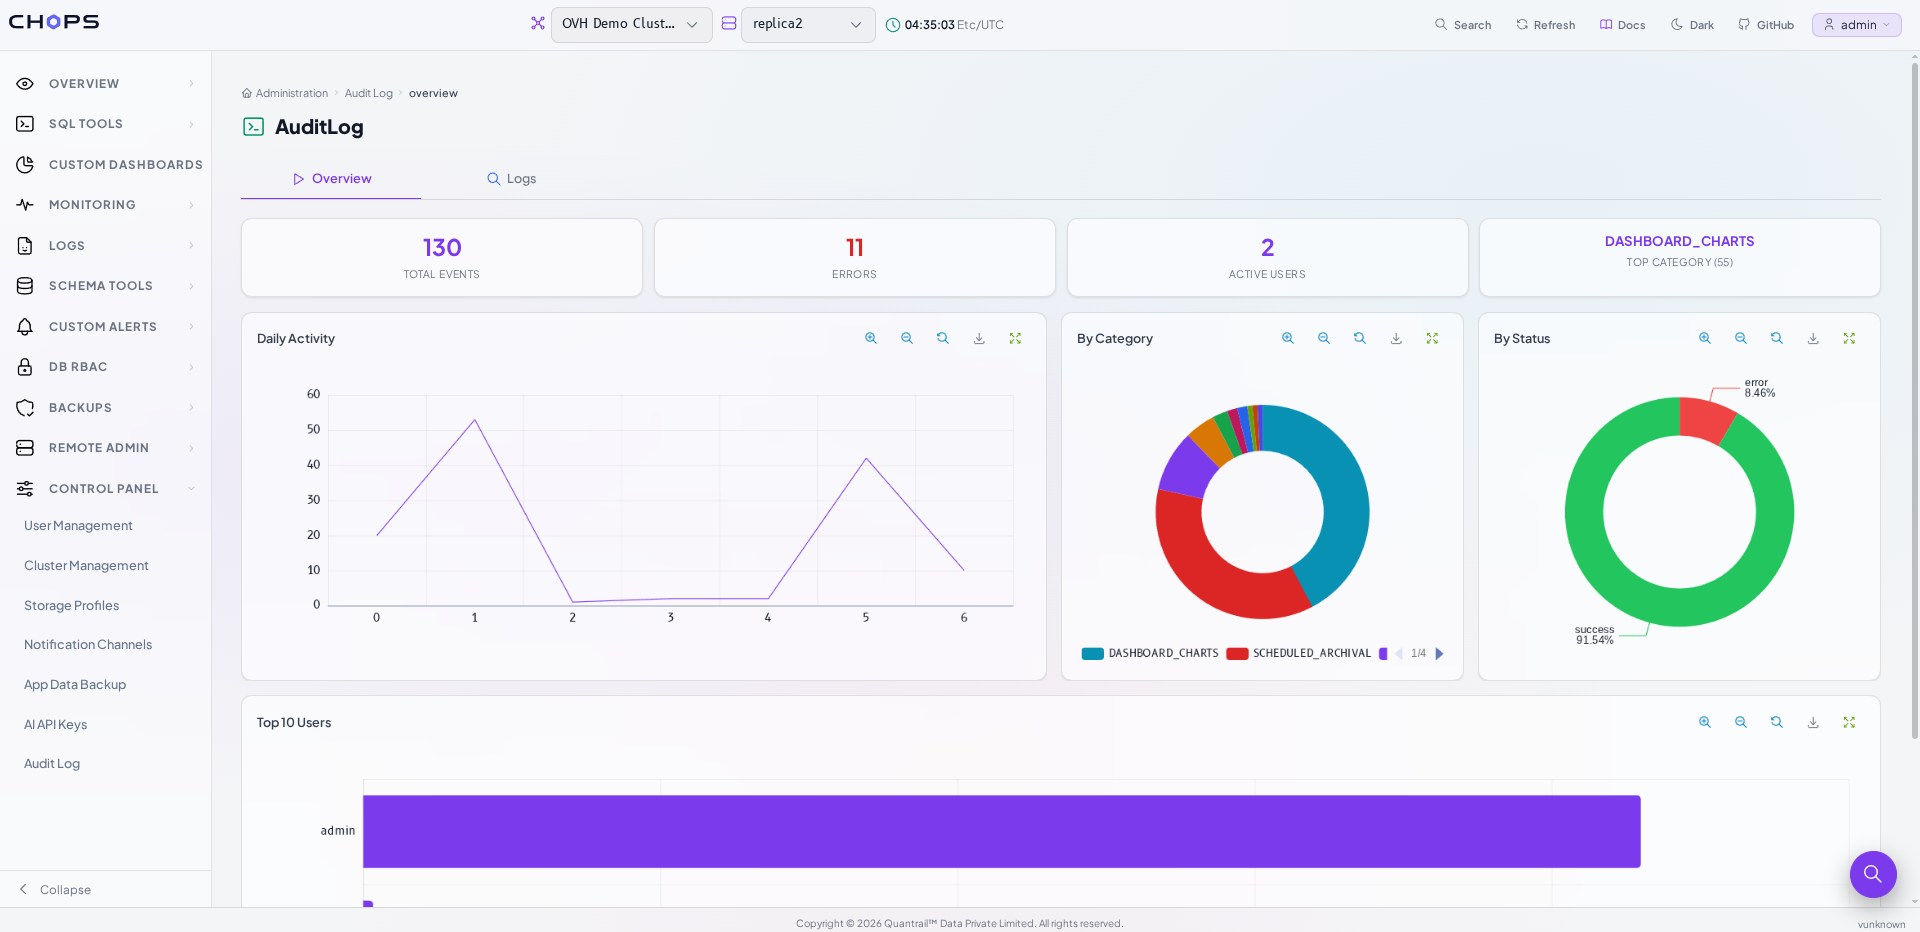
The Overview tab: activity at a glance before you go looking for a specific event.
What an audit log actually is
An audit log is a durable record of actions taken in an application: who did something, what they did, when they did it, where they connected from, and whether it worked.
It works alongside the logs you already have, and each one answers a different question. Your application logs explain how the software behaved. ClickHouse®'s system.query_log and system.session_log show what reached each server. The CHOps audit log adds the human layer on top: what your team did through CHOps, tied to a person and the role they held, across every cluster you manage, in one place and kept for as long as your retention policy says. Run all three and you have the complete picture the software's view, the database's view, and the people behind both.
Why it matters
Accountability. In an environment where several engineers share admin access, a name and a timestamp on every change turns a shrug into a fact.
Forensics. When something breaks, the first useful question is "what changed just before this?" A filtered view of the last hour usually answers it faster than reading server logs.
Compliance evidence. SOC 2, ISO 27001 and internal audits all ask you to demonstrate access control over production data. A searchable, exportable trail is the evidence.
Deterrence. People are more careful when they know actions are recorded. That effect is free.
What CHOps Pro records
Every audited event captures a consistent set of fields:
| Field | What it holds |
|---|---|
| Timestamp | When the action happened |
| User and role | Who performed it, and the role they held at the time |
| Source IP | Where the request came from |
| Category and action | What kind of change it was |
| Target | The type, ID and name of the thing that was changed |
| SQL text | The statement, where the action involved one |
| Cluster and node | Which cluster and host the action was aimed at |
| Status | Success or error, with the error message on failure |
Failures are recorded alongside successes. A rejected attempt to change a setting is often more interesting than a successful one.
Events are grouped into categories covering the operational surface of CHOps: clusters, users, settings, dashboards and charts, alert rules and channels, backups, application backups, API keys, remote admin, scheduled archival, and email reports. Within those, actions range from create, update, delete and alter through to password changes and resets, service start, stop and restart, manual and scheduled backups, key generation, and purges.
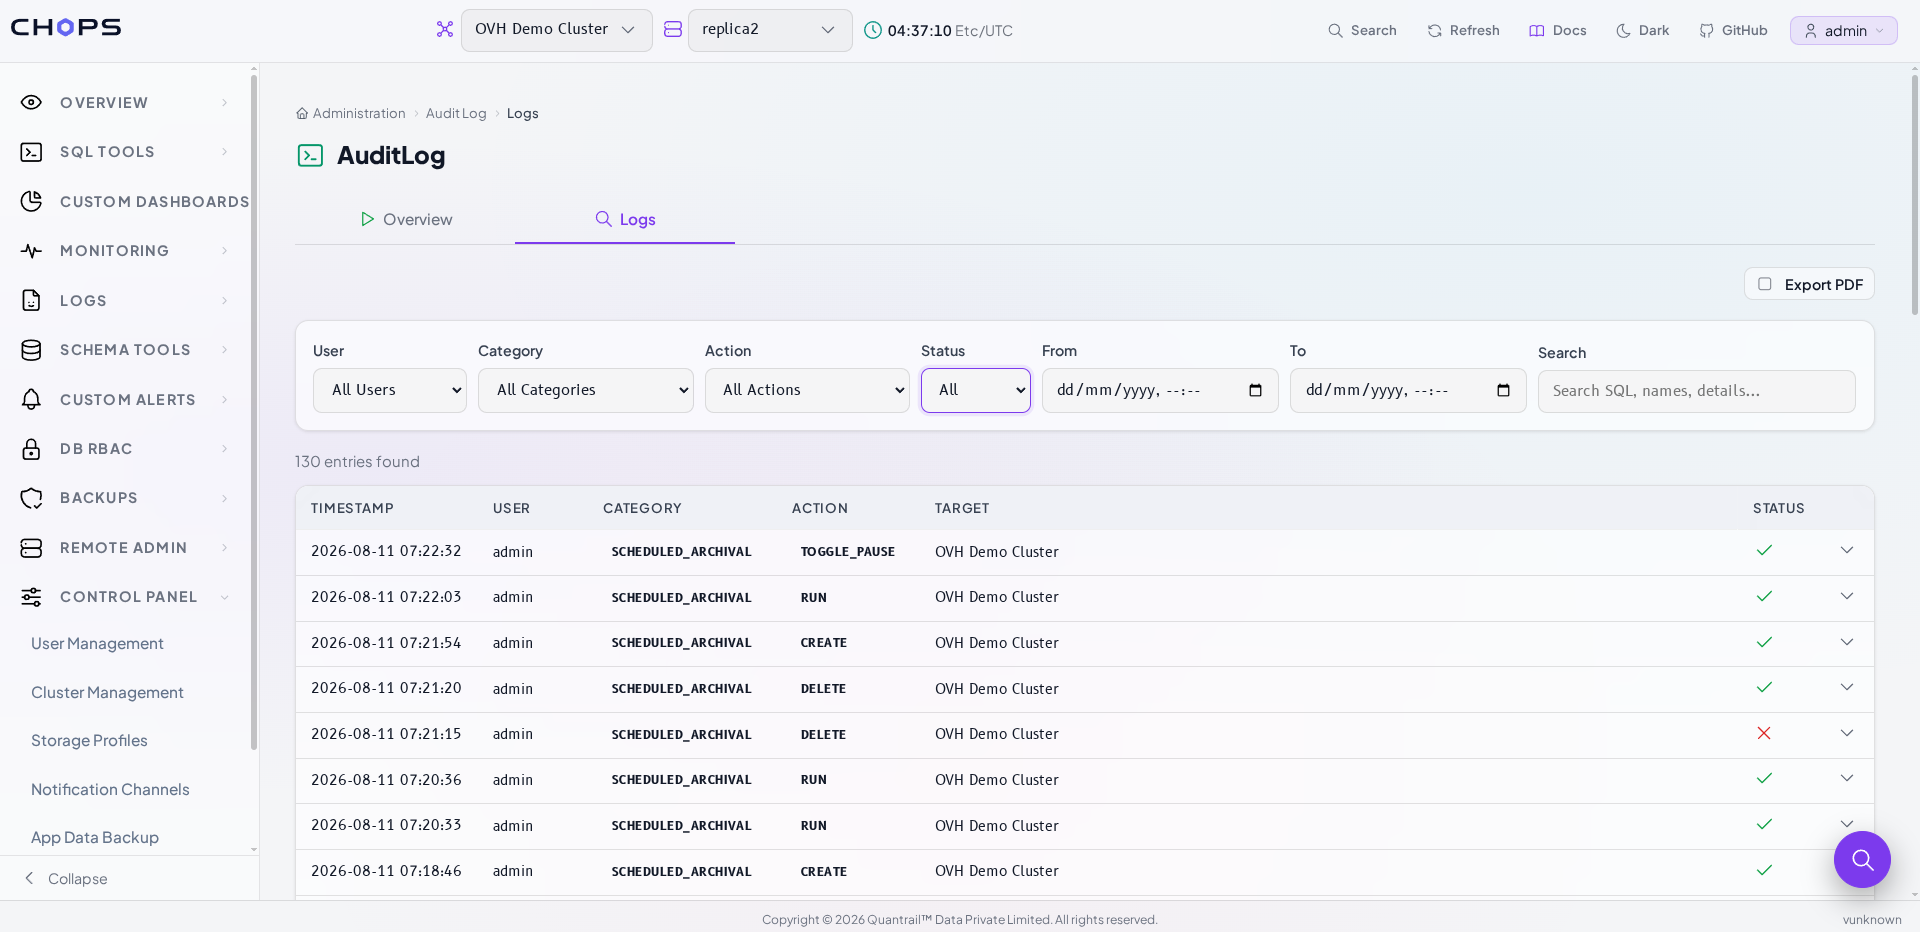
The Logs tab: filter by user, category, action, status or date range, then search the text of what was run.
Key features
- Two views. An Overview tab charts daily activity, events by category, the success-to-error split, and your ten busiest users. A Logs tab gives you the raw table, with each row expandable to its full detail.
- Filter and search. Narrow by user, category, action, status or date range, and run a free-text search across SQL text, target names and details.
- Tamper-evident exports. Export a filtered report to PDF and CHOps records a SHA-256 hash of that exact file. Send the PDF back to the verification endpoint later and CHOps confirms whether it is a genuine, unmodified export from your instance useful when a report leaves your hands and goes to an auditor. Exports are themselves audited.
- Admin-only. Every audit endpoint is restricted to administrators.
- Isolated storage. The audit trail lives in its own database, separate from application data, so its history stands on its own.
- Never in the way. Audit writes are fire-and-forget. A full or unavailable audit database can slow nothing down and break nothing.
- Built for volume. Composite indexes and cursor-based pagination keep queries fast however deep the history runs.
- Retention you control. Set a retention window 90 days by default and a nightly job trims older entries in batches and reclaims the disk space.
A five-minute investigation
Here is what using it actually looks like. Queries started failing on your staging cluster around 14:00 and nobody owns up to a change.
Open the Overview tab. The daily activity chart shows a bump in events yesterday afternoon, and the success-versus-error donut shows errors where there normally are none. So something did happen, and some of it did not go cleanly.
Move to the Logs tab and narrow it down. Set the date range to cover the afternoon. Leave everything else open at first you are looking for volume and shape, not a specific row. Twenty events, three users.
Filter by category. Most of the twenty are routine dashboard edits. Two are settings changes. Filter to the settings category and you are down to the two rows that could plausibly matter.
Expand the row. Each entry opens to its full detail: the user and the role they held, the source IP, the target cluster and node, the statement where one was involved, and the status. One of the two changes came back as an error, with the message attached.
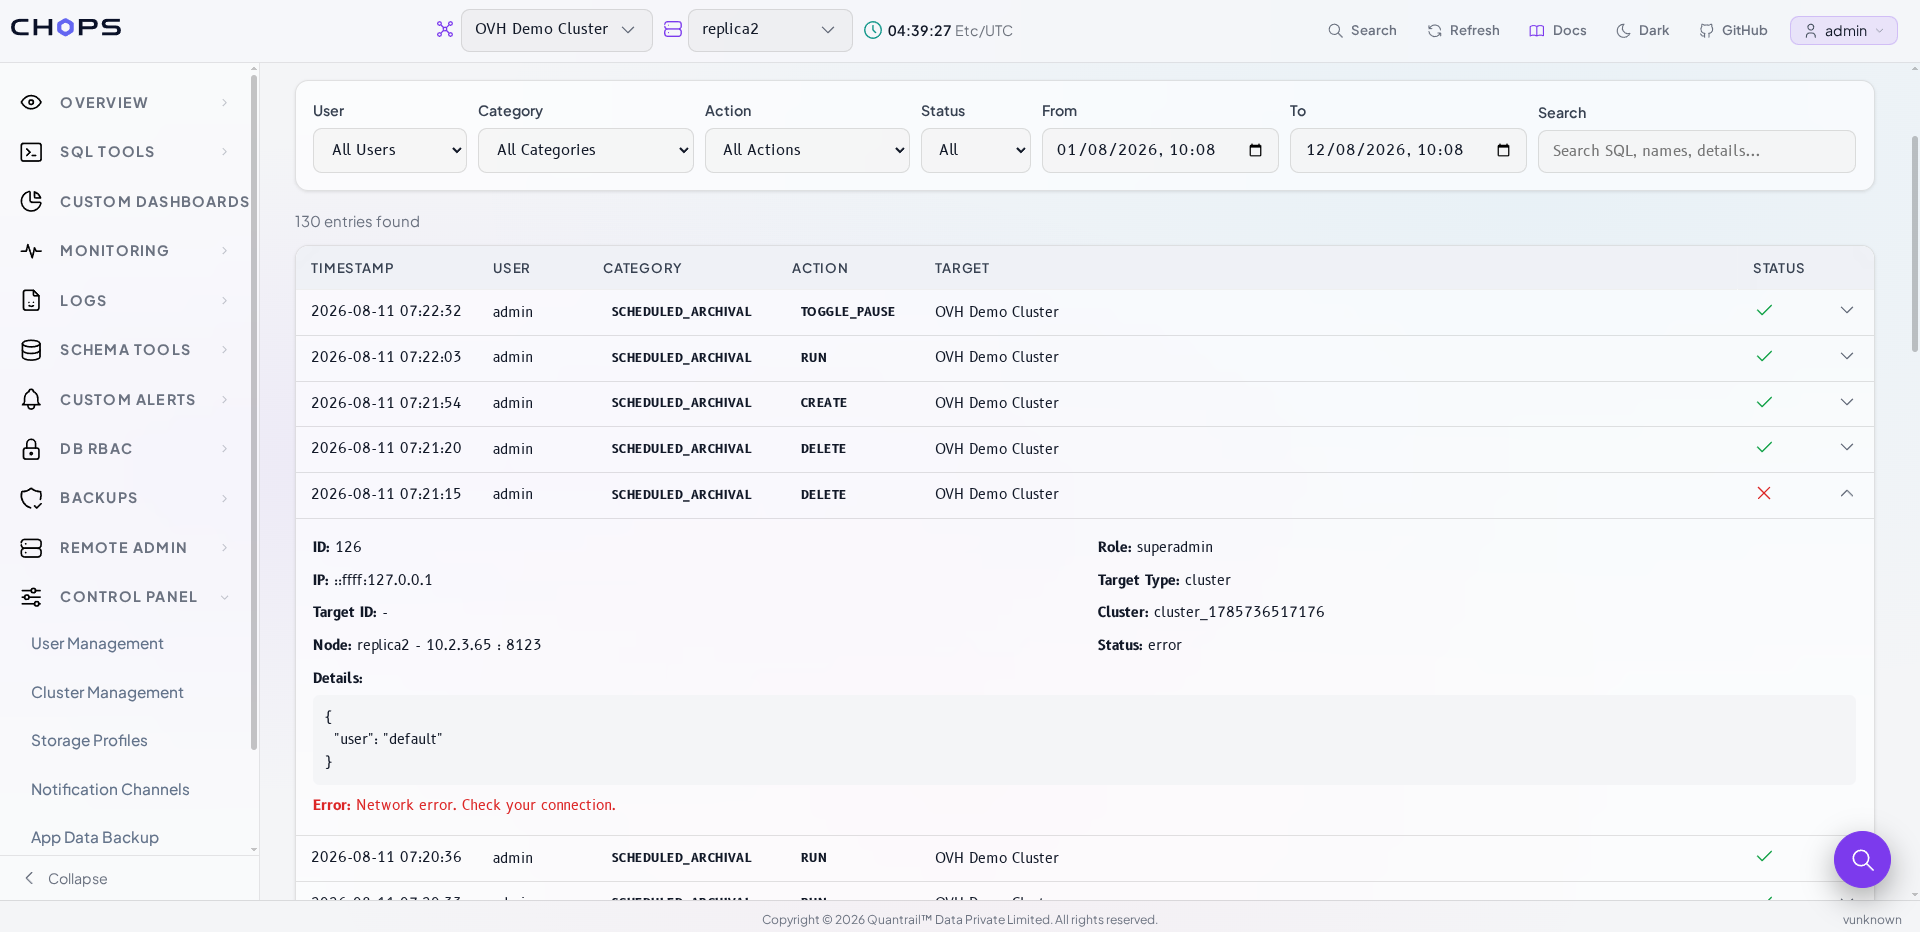
One expanded entry answers who, what, when, from where, against which cluster, and whether it worked.
Export it. If the answer needs to go to someone outside the team, export the filtered view to PDF. The report carries its own summary, a generated-by line, and page footers, and CHOps keeps a hash of the file so its authenticity can be confirmed later.
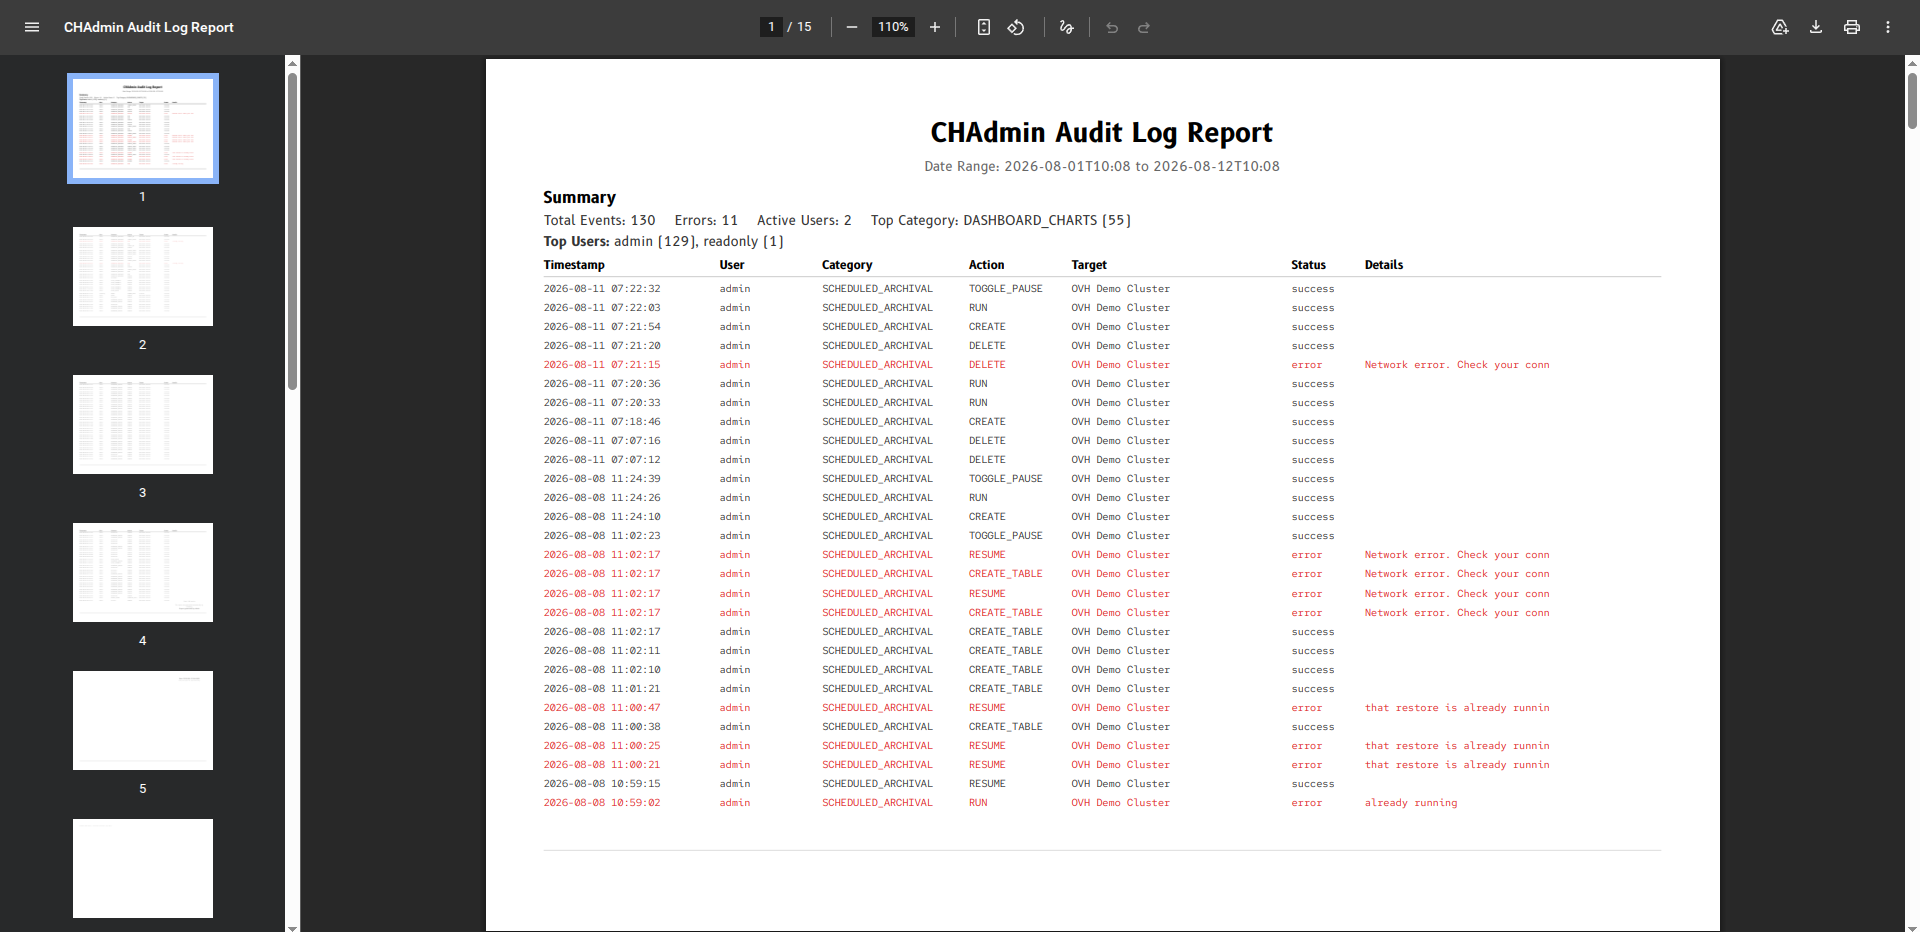
The exported report. CHOps stores a SHA-256 hash of the exact file, so it can confirm later whether a copy is genuine.
Five minutes, no guesswork, and a document at the end of it.
What to audit in your own application
The specifics above are CHOps, but the design decisions behind them apply to any application adding an audit trail. If you are building one, these are the choices that matter most.
Record failures, not just successes. A denied action is a security signal. An audit log that only contains things that worked will not show you someone probing at the edges of their permissions.
Capture the actor's role at the time, not just their name. Roles change. A record saying a user was an administrator when they made a change is worth much more six months later than a username you have to go and look up.
Never let auditing break the request. Audit writes should be fire-and-forget and wrapped so they cannot throw. If the audit store is full, unreachable or corrupt, the application must keep serving. A logging feature that can take production down is a liability.
Keep it separate from application data. A distinct store means the trail is not caught up in migrations, resets or restores of your main database.
Cap what you store per event. Free-text fields and SQL statements need a length limit, or one pathological entry bloats the store. Strip control characters from anything user-supplied while you are at it log injection is a real technique.
Plan retention on day one. Decide how long you keep entries, delete in batches so cleanup never holds a long lock, and reclaim the space afterwards. Retention is also a compliance question: too short and you fail the audit, indefinite and you are storing personal data you cannot justify.
Index for the queries you will actually run. Audit tables are written constantly and read in narrow slices: this user, this window, this category. Composite indexes on those combinations, and cursor-based pagination instead of deep offsets, are the difference between a trail you use and one everyone avoids.
Restrict who can read it. An audit log contains a map of your operational activity. Treat it as sensitive and put it behind your strongest role check.
Common questions
Does it slow the application down? No. Writes are fire-and-forget and go to a local store that never sits in the request path.
How much space does it need? That depends on your team's activity, but retention keeps it bounded. Entries older than the window are removed nightly and the space is reclaimed.
Who can see the audit log? Administrators only.
Why not just use the database's own logs? ClickHouse®'s system tables tell you what reached the server, per node, for as long as their own retention allows. They will not tell you who clicked what in your admin tool, tie an action to an application user and role, or span the clusters you manage. The two are complementary use both.
Conclusion
When something changes in your ClickHouse® environment, you shouldn’t have to guess who did it. CHOps Pro’s audit log gives your team a clear, searchable record of every important action, from successful changes to failed attempts.
With the right audit trail, investigations take minutes instead of hours, accountability is clear, and compliance evidence is always within reach. When the question is “Who did that?”, CHOps Pro gives you the answer.
Getting it
Audit logging ships in CHOps Pro audit and SSO features, the commercial edition, alongside scheduled archival, scheduled email reports, extended alerting and remote cluster management. The Community edition records who can log in and what role they hold; Pro records what they actually did.
To enable it, visit ch-ops.io or contact Quantrail™ Data.
- Installation Guide: CH-Ops Installation Guide
- Docs: ch-ops.io/docs
- GitHub: Quantrail-Data/CH-Ops