A query can look perfectly healthy when all you see is its final execution time.
It ran for 12 seconds. It used 8 GB of memory. It read 40 GB from disk.
But those numbers don't tell you the whole story.
When did the memory spike? When did the query start waiting on disk? Did cache misses increase halfway through execution? Did a JOIN suddenly consume most of the memory? Did the query spill to disk near the end?
A final query profile can tell you what happened overall. But to understand why it happened, you need to see what the query was doing while it was running.
That's where Query Metrics comes in.
Query Metrics provides a second-by-second timeline of resource consumption during query execution. It exposes memory, CPU, disk I/O, cache hits and misses, network activity, and hundreds of other counters.
Think of it as a heart-rate monitor for a query.
Why Per-Second Metrics Matter
Consider a query that eventually reaches 10 GB of memory usage.
That number alone doesn't tell you much.
Maybe memory gradually increased from 1 GB to 10 GB because the query was building a large aggregation state.
Or maybe memory stayed around 2 GB for most of the query, suddenly jumped to 10 GB while building a JOIN hash table, and then dropped back down.
Those are completely different problems.
The same applies to disk I/O.
A query reading 100 GB over 30 seconds may be perfectly normal for its workload. But if disk writes suddenly spike at the 20-second mark, the query may have started spilling intermediate results to disk.
Without a timeline, you see the final numbers.
With a timeline, you see the behavior.
Query Metrics takes resource snapshots every second for queries that run for more than roughly one second. These snapshots are stored in system.query_metric_log, with each snapshot containing hundreds of counters.
Instead of asking:
"Why was this query slow?"
you can ask:
"What happened at second 7 that made this query slow?"
That is a much more useful question.
From Query Duration to a Query Timeline
Query duration tells you how long a query took.
Query Metrics helps explain what happened during that time.
The raw metric snapshots are converted into visual timelines grouped by category and unit. The X-axis represents the query's execution time, with one data point per second, while the Y-axis shows the metric value.
For example, a query might show:
- Memory steadily increasing
- CPU remaining relatively flat
- Disk reads suddenly increasing
- Cache misses appearing midway through execution
- Network activity spiking near the end
Instead of looking through hundreds of raw counters, you can visually follow the query's execution.
Metrics with different units are also separated into different charts, so bytes, counts, and time measurements don't get mixed together on the same scale.
The result is much easier to reason about:
You don't just see the result of the query. You see its journey.
Getting Started
Getting to a query's metrics is straightforward:
- Go to Tools → Query Metrics.
- Choose the From and To timestamps.
- Click Load Queries.
- Select a query that has per-second metric data.
- Click Use This Query.
- Click Show Query Metrics.
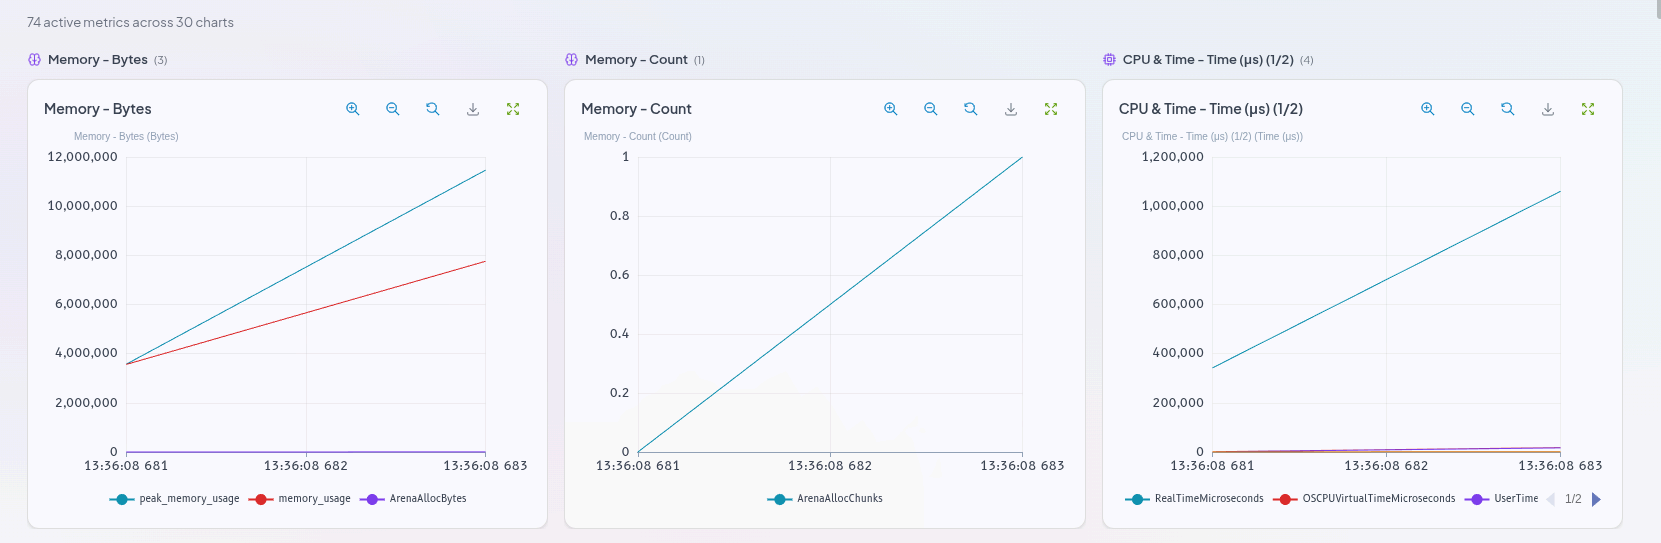
The charts are then grouped by category and unit.
Only categories containing non-zero data are displayed. A simple query may show only Memory and CPU, while a more complex query involving JOINs, disk spilling, remote reads, or distributed execution can activate many more categories.
This keeps the visualization focused on what actually happened during that query instead of showing hundreds of irrelevant metrics.
Start With the Memory Chart
Memory is often the first place to look when investigating an unstable query.
The Memory chart typically includes:
memory_usage— memory currently allocated by the querypeak_memory_usage— the highest memory usage seen so far
The relationship between these two metrics can tell you a lot.
Both lines climb steadily
The query may be continuously accumulating data in memory.
This can happen during operations such as:
- Hash table construction
- Sorting
- Aggregation
Memory spikes and then drops
The query experienced a temporary memory burst.
A large hash JOIN is one example. The query may allocate a large hash table, use it, and then release that memory.
Peak memory keeps climbing
This can indicate that the query is progressively consuming more memory throughout its execution.
Peak memory reaches the configured limit
The query may be killed or throttled because it exceeded max_memory_usage.
This is one of the biggest advantages of a timeline.
A final memory number tells you how much memory was used.
A per-second graph tells you when and how that memory was used.
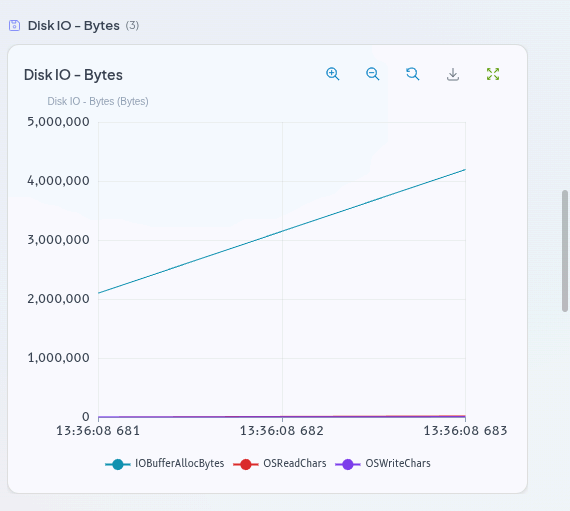
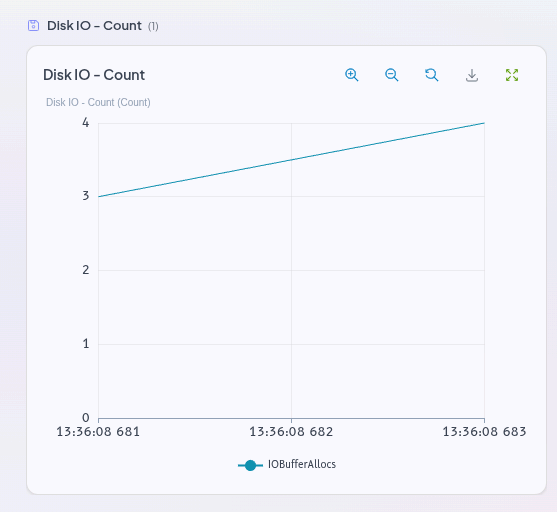
Disk I/O: Find the Moment the Query Starts Waiting
Disk metrics can reveal another important part of a query's execution.
OSReadBytes represents bytes read from disk. A steadily increasing value generally means the query is scanning data.
OSWriteBytes is particularly interesting when it suddenly spikes. A spike can indicate that intermediate results are being written to disk.
Then there is:
DiskReadElapsedMicroseconds
This represents the time spent waiting for disk reads.
These metrics help distinguish between two very different situations:
The query is reading a lot of data.
versus
The query is spending a lot of time waiting for storage.
Those problems require very different optimizations.
If the query is simply reading too much data, you may need to reduce the amount of data being scanned.
If the query is spending significant time waiting for storage, the storage layer or filesystem cache may deserve closer attention.
Cache Hits vs. Cache Misses
Cache behavior is another area where a final query profile can hide useful information.
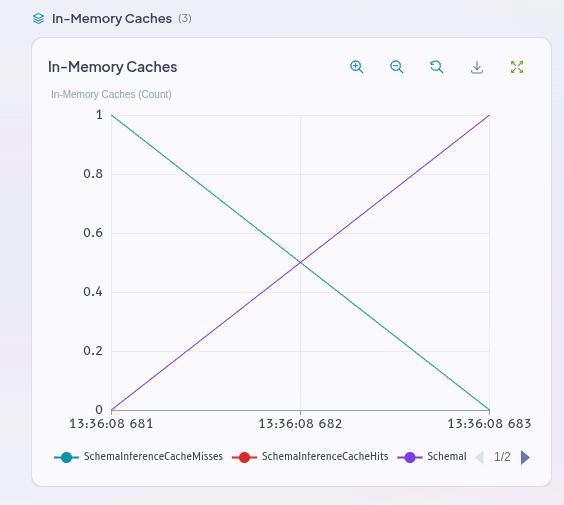
Query Metrics exposes counters such as:
MarkCacheHitsMarkCacheMissesPageCacheHitsPageCacheMisses
Comparing hits and misses can help determine whether the cache is actually helping the workload.
For example, a query with many mark-cache misses may be repeatedly going to disk instead of finding the required information in memory.
The documentation uses a mark-cache miss ratio above 10% as a signal that the cache may be cold or too small.
The important part is that you aren't simply observing:
"The query is slow."
You can start connecting that slowdown to a specific resource behavior.
The Most Useful Pattern: Correlating Spikes
The real power of per-second metrics appears when you stop looking at individual charts in isolation.
Suppose peak_memory_usage suddenly jumps at second 18.
Don't stop at the memory chart.
Look at the other charts at that exact moment.
Maybe ArenaAllocBytes starts climbing at the same time.
That suggests the query is allocating memory for a large aggregation or sort.
Or perhaps an External Operations category appears immediately afterward.
That could mean the query exceeded its in-memory limits and started spilling intermediate results to disk.
The debugging workflow becomes:
- Find the timestamp where the spike occurs.
- Look at the other metrics around that timestamp.
- Identify what operation was becoming more expensive.
- Determine whether the query transitioned from an in-memory operation to an external operation.
This is where a timeline becomes more than a visualization.
It becomes a way to reconstruct what the query was doing.
JOINs Have Their Own Story
JOIN-heavy queries can be particularly interesting because memory usage may spike during hash-table construction.
For a SELECT with a JOIN, Query Metrics exposes metrics such as:
peak_memory_usageJoinBuildTableRowsJoinProbeTableRowsJoinResultRowsExternalJoinWritePart
A large gap between steady-state memory and peak memory can indicate that the JOIN's hash table became large.
You can also compare the number of rows involved in building and probing the JOIN.
If the JOIN result is dramatically larger than its inputs, that may indicate a many-to-many JOIN and is worth investigating.
And if external JOIN metrics appear, the JOIN has spilled to disk.
That gives you considerably more information than simply knowing:
"The JOIN was slow."
You can start asking:
Was the build side too large? Did the JOIN produce too many rows? Did it exceed memory and spill?
GROUP BY and ORDER BY: Watch for Spilling
Aggregation and sorting introduce another common source of performance problems.
For these queries, ArenaAllocBytes can reveal a steadily growing aggregation state.
This can be a sign of a large aggregation workload, particularly with high-cardinality GROUP BY operations.
External-operation metrics can reveal when sorting or aggregation spills to disk:
ExternalSortWritePartExternalSortMergeExternalAggregationWritePartExternalAggregationMerge
Spilling isn't necessarily an error.
It is a safety mechanism that allows an operation to continue when it cannot fit entirely in memory.
But it is significantly slower than keeping the operation in memory.
So if the timeline shows memory increasing and then external writes suddenly appearing, you've found an important part of the query's performance story.
CPU-Bound or Waiting?
A query can consume a lot of wall-clock time without actually spending that time computing.
Query Metrics separates several time measurements, including:
RealTimeMicrosecondsUserTimeMicrosecondsSystemTimeMicroseconds
If real time is significantly greater than user plus system CPU time, the query is likely spending substantial time waiting—for example on I/O, locks, or network activity.
If user CPU time dominates, the query is more likely CPU-bound.
This distinction matters.
Adding more CPU won't fix a query that is mostly waiting on storage.
Likewise, increasing memory won't necessarily solve a problem caused by network latency.
The timeline helps answer a fundamental question:
Is the query spending its time computing, or waiting?
Distributed Queries Add Another Dimension
When a query runs across shards, network metrics become important.
Query Metrics exposes:
NetworkSendBytesNetworkReceiveBytesNetworkReceiveElapsedMicrosecondsDistributedConnectionMissCount
Large amounts of data moving between shards may indicate that filters could be pushed down or that PREWHERE could reduce the amount of data being transferred.
High network receive time can point toward network bandwidth or latency as the bottleneck.
Again, the goal isn't simply to find a large number.
It's to understand where in the query's lifetime that behavior happened.
How Query Metrics Finds the Important Counters
There is an interesting challenge behind this feature.
system.query_metric_log has more than 700 columns, and the available columns can change between ClickHouse® versions.
Hardcoding a list of metrics would make the feature fragile.
Instead, Query Metrics discovers the active metrics dynamically.
For the selected query, it:
- Fetches the rows from
system.query_metric_log. - Scans every row to find columns containing non-zero values.
- Sorts metrics by activity.
- Keeps the 100 most active metrics when more than 100 are present.
- Classifies each metric by category and unit.
- Splits crowded categories into multiple charts.
- Builds the charts directly from the fetched data.
This approach is especially useful because metrics can become active mid-query.
For example, an external sort metric might remain zero for the first few seconds and suddenly become non-zero when the sort starts spilling.
Looking across all snapshots catches that transition.
You Don't Need to Understand Hundreds of Metrics
At first, hundreds of metrics can feel overwhelming.
But you don't need to memorize every counter.
Start with a few questions.
Did memory spike?
Look at:
memory_usage vs. peak_memory_usage
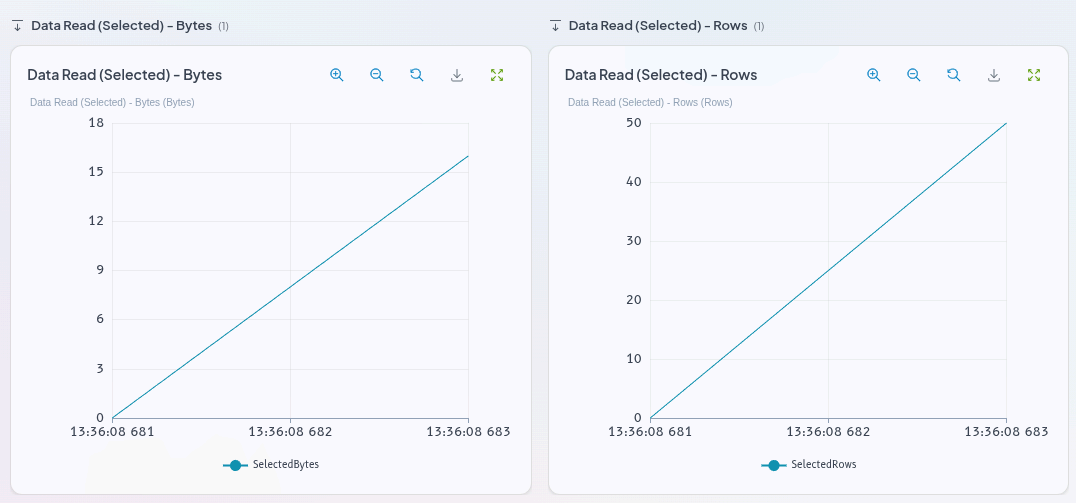
Did the query read too much?
Look at:
OSReadBytes, SelectedRows, and SelectedMarks
Is storage the bottleneck?
Look at:
DiskReadElapsedMicroseconds
Is the cache helping?
Compare:
MarkCacheHits vs. MarkCacheMisses
Did the query spill?
Look for:
ExternalSort*, ExternalAggregation*, or ExternalJoin*
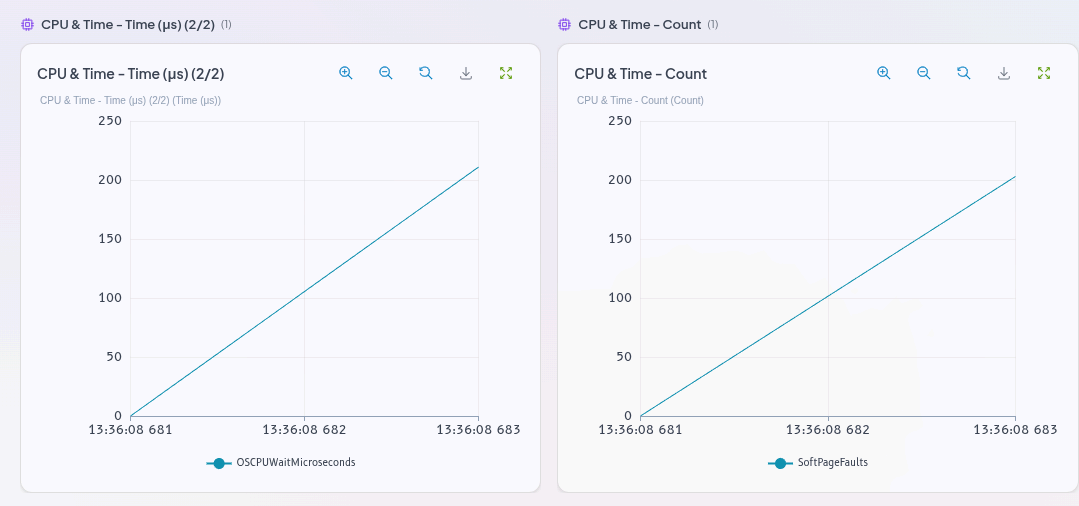
Is it CPU-bound?
Compare:
RealTimeMicroseconds with the CPU time metrics.
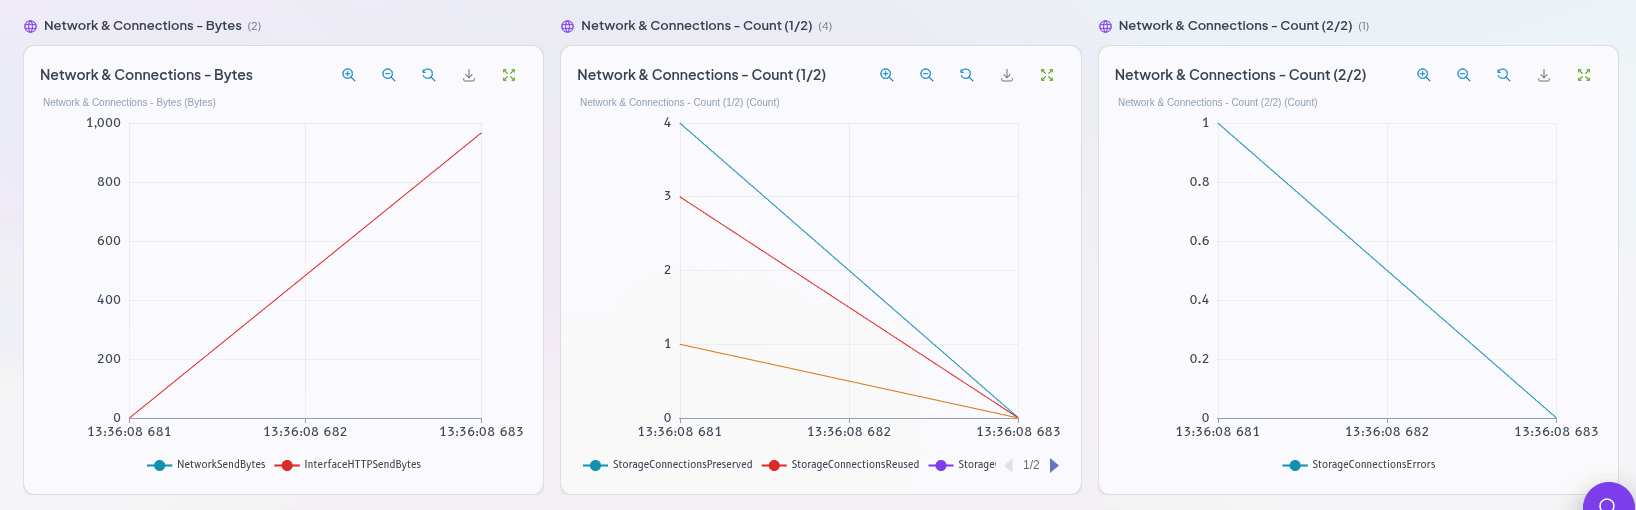
Is a distributed query moving too much data?
Look at:
NetworkSendBytes and NetworkReceiveBytes
These metrics cover many of the most common performance investigations.
The goal isn't to understand everything.
The goal is to find the few metrics that explain what changed.
Compare a Slow Query With a Fast Query
One of the most useful ways to use Query Metrics is to compare two queries.
Start with the slow query.
Identify the categories with unusually high activity.
Then examine the fast query.
The differences can point directly toward the cause.
For example, imagine the slow query has many MarkCacheMisses, while the fast query has significantly more MarkCacheHits.
That suggests the slow query is reading more from disk while the fast query is benefiting from cache.
The comparison turns performance debugging into a much simpler question:
What did the fast query avoid doing that the slow query had to do?
This can be far more actionable than simply comparing execution times.
Before You Start
There are a few prerequisites for Query Metrics:
- ClickHouse® 26.3 LTS or newer
query_metric_logenabled- A query lasting more than roughly one second
- SELECT access to
system.query_metric_logandsystem.query_log
On ClickHouse® 26.3 LTS, query_metric_log is enabled by default.
The sampling interval defaults to 1000 ms.
You can configure the interval using query_metric_log_interval.
Lower values provide more granular data, but they also increase collection overhead. Setting it to 0 disables metric collection entirely.
So there is a trade-off:
More detail means more collection overhead.
A Practical Debugging Workflow
When a query suddenly becomes slow—or gets killed for exceeding its memory limit—don't start by staring at the final query duration.
Start with the timeline.
Step 1: Find the query
Load queries for the relevant time range and select the query you want to investigate.
Step 2: Look at Memory
Find the point where peak_memory_usage changes sharply.
Step 3: Check what happened at that timestamp
Look at CPU, disk, cache, JOIN, aggregation, and external-operation metrics.
Step 4: Identify the transition
Did the query start reading heavily from disk?
Did a JOIN hash table grow?
Did aggregation state increase?
Did the operation start spilling?
Step 5: Validate with related metrics
One metric rarely tells the whole story.
Look for multiple metrics changing together.
Step 6: Compare against a healthy query
If possible, compare the timeline with a faster or previously successful execution.
This approach shifts debugging from guessing to observation.
Instead of asking:
"What configuration should I change?"
you first ask:
"What actually happened?"
That usually leads to a much better fix.
Conclusion
Query duration tells you that something happened.
Per-second Query Metrics helps you understand what happened along the way.
A memory spike, a burst of disk I/O, a sudden increase in cache misses, a growing JOIN hash table, or an operation spilling to disk doesn't magically appear at the end of a query. It happens at a specific point during execution.
That is what makes the timeline so valuable.
Instead of looking at a query as a collection of final numbers-12 seconds, 8 GB of memory, 40 GB read-you can follow its execution second by second and correlate changes across memory, CPU, storage, cache, network, and execution metrics.
The debugging workflow becomes simple:
Find the spike → find what changed → correlate the metrics → identify the bottleneck → fix the query.
That's the real value of Query Metrics.
It doesn't just tell you that a query was slow or expensive. It gives you the evidence needed to understand why.
And when a production query starts behaving differently, that difference between knowing something is wrong and knowing exactly when and why it went wrong can save a lot of debugging time.
Don't just measure how long a query takes. See what it did along the way.