When something goes wrong in a ClickHouse® deployment, logs are often the first place to look. But investigating them traditionally means knowing which system table to query, writing SQL, choosing the right time range, and filtering through the results.
CH-Ops provides a visual way to explore these logs without writing SQL.
From the Logs section, you can choose a log type, select a time range, view an overview of the activity, and switch to Search when you need to investigate individual log records.
What Is CH-Ops?
CH-Ops is a browser-based operations platform for ClickHouse® that provides a visual interface for managing and monitoring ClickHouse® deployments.
Instead of relying entirely on the command line or HTTP API, CH-Ops brings common operational tasks into a single web application. It supports capabilities such as SQL querying, cluster monitoring, user management, backups, alerts, dashboards, and log exploration.
In this article, we'll focus on the Logs section and how CH-Ops makes ClickHouse® log investigation easier without requiring SQL for every search.
Exploring ClickHouse® Logs in CH-Ops
The Logs section provides dedicated views for different ClickHouse® system logs:
- Crash Log - investigate server crashes
- Error Log - understand recurring error types
- Text Log - explore server messages across different log levels
- Session Log - review login and logout activity
Each log provides two views:
- Overview - understand the overall activity for a selected time range.
- Search - find specific records using filters relevant to that log.
Quick time ranges such as 1h, 6h, 24h, 48h, 7d, and 30d make it easy to focus on a specific period.
1. Crash Log: Investigating Server Crashes
The Crash Log is based on system.crash_log and is useful when a ClickHouse® process unexpectedly stops or a node restarts.
The Overview provides a quick summary of crash activity, including:
- Total crashes
- Distinct signals
- Affected ClickHouse® versions
- Recent crash activity
- Crash distribution by signal and version
- Crash incidents
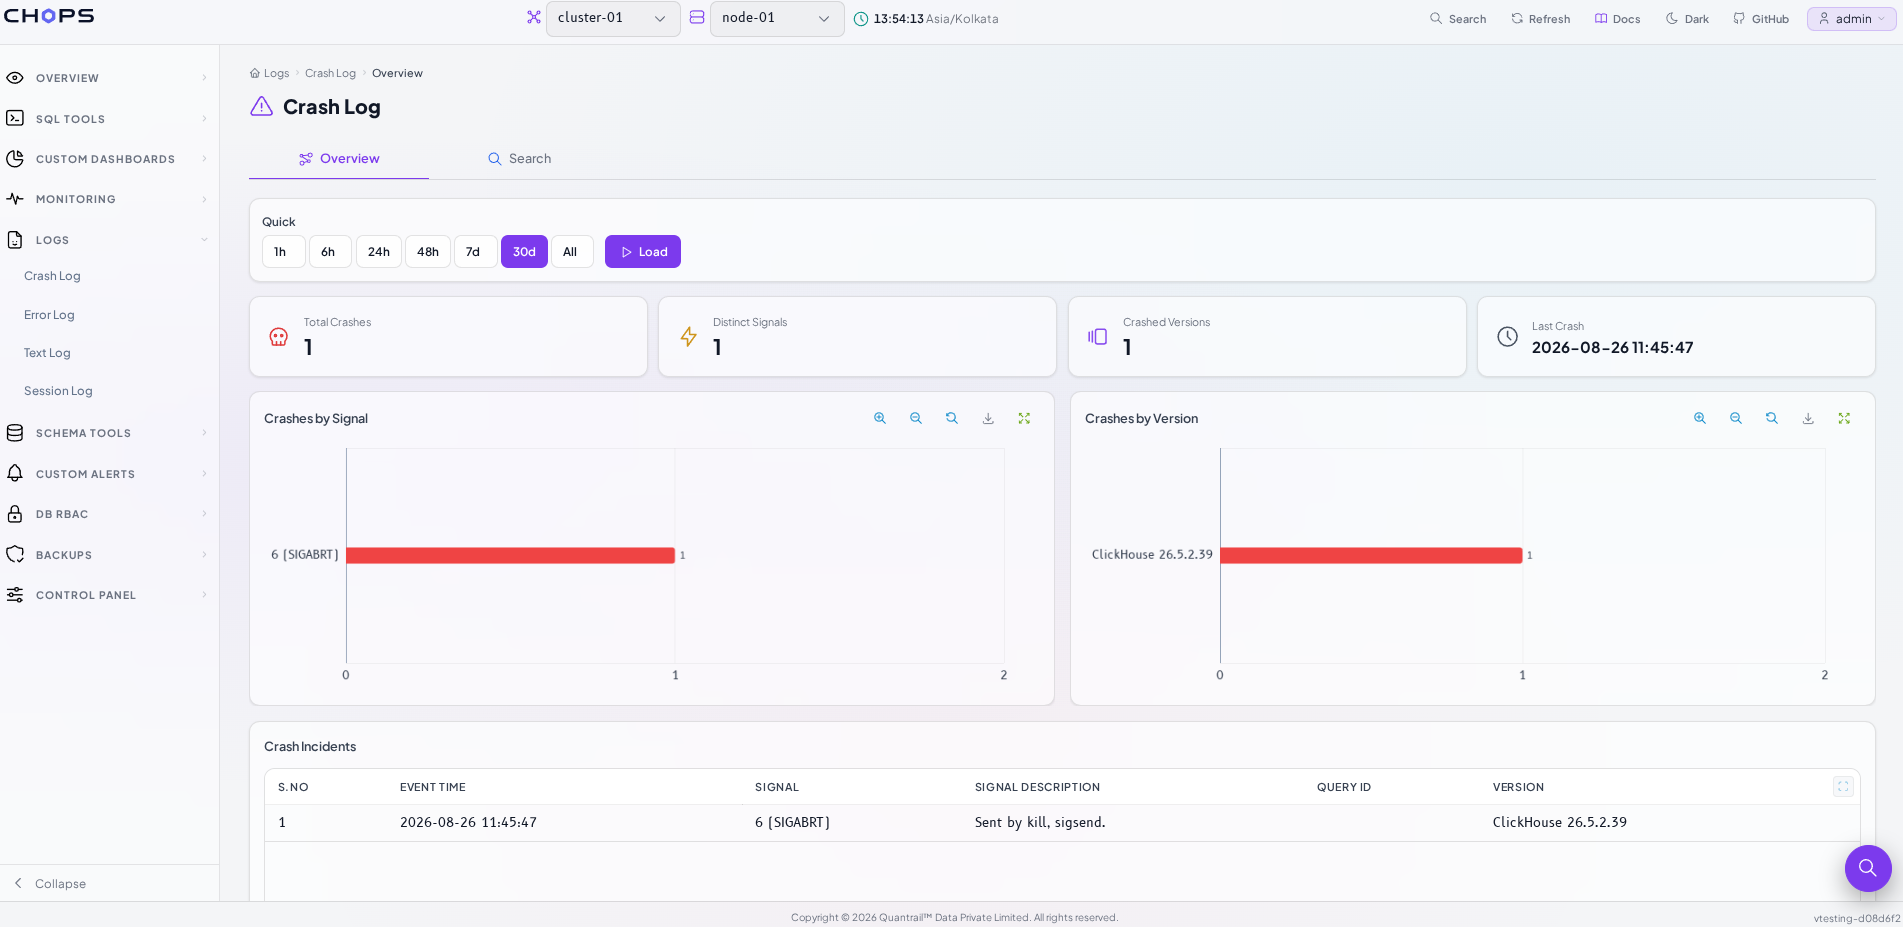
Once a crash is identified, the Search view can be used to inspect individual crash records using details such as the event time, signal, query information, and exception trace.
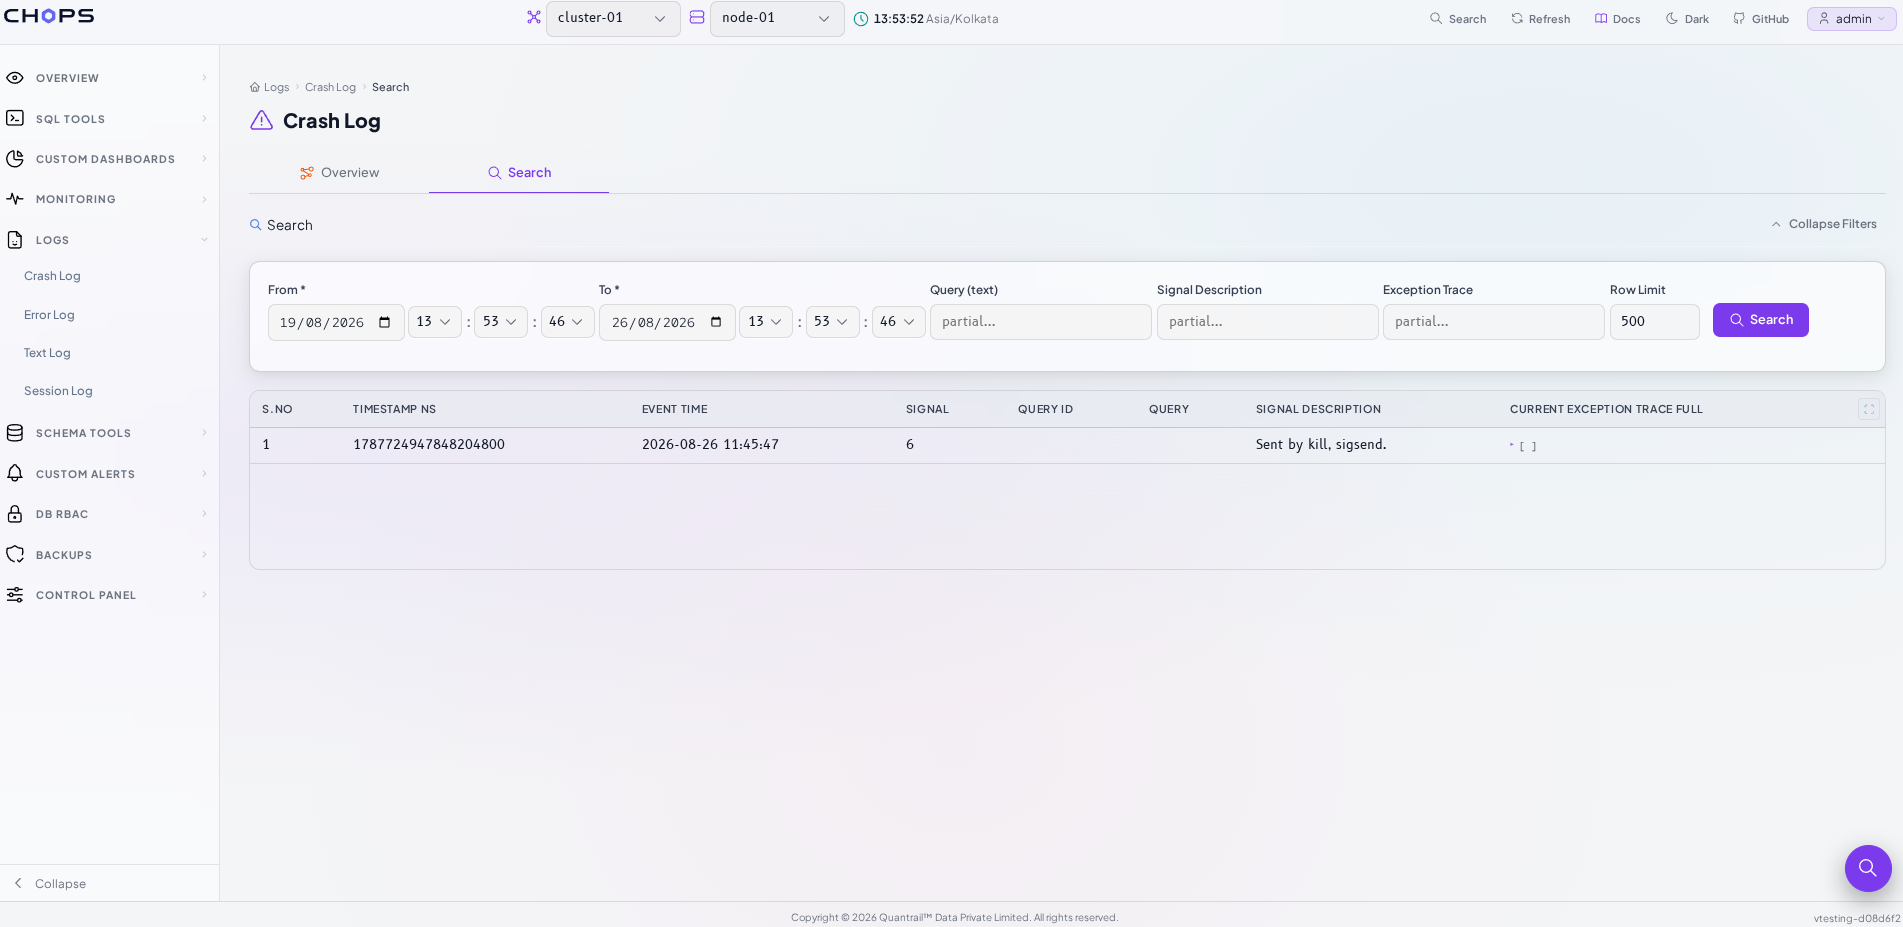
This makes it easier to move from “Did a crash happen?” to “What exactly was recorded when it happened?”
An empty Crash Log can also be a good result. If no crashes were recorded during the selected period, there may simply be nothing to investigate.
2. Error Log: Finding Recurring Errors
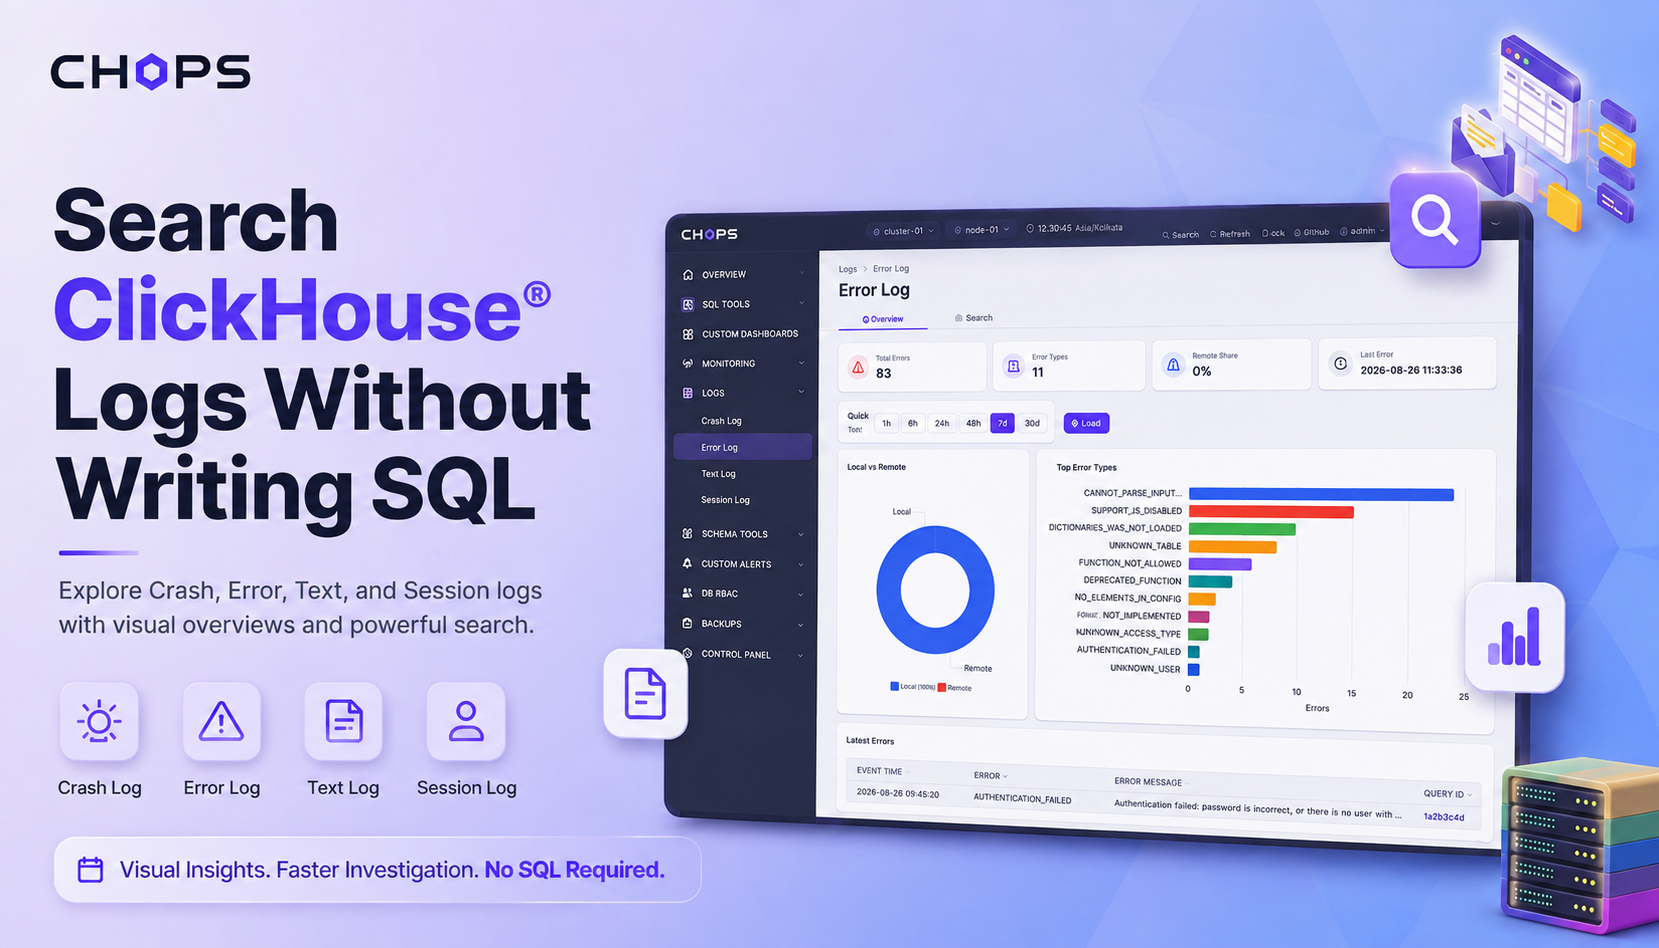
The Error Log is based on system.error_log and helps identify the types of errors occurring on the server.
The Overview summarizes the selected period through metrics and visualizations such as:
- Total errors
- Number of error types
- Local versus remote errors
- Top error types
- Latest error
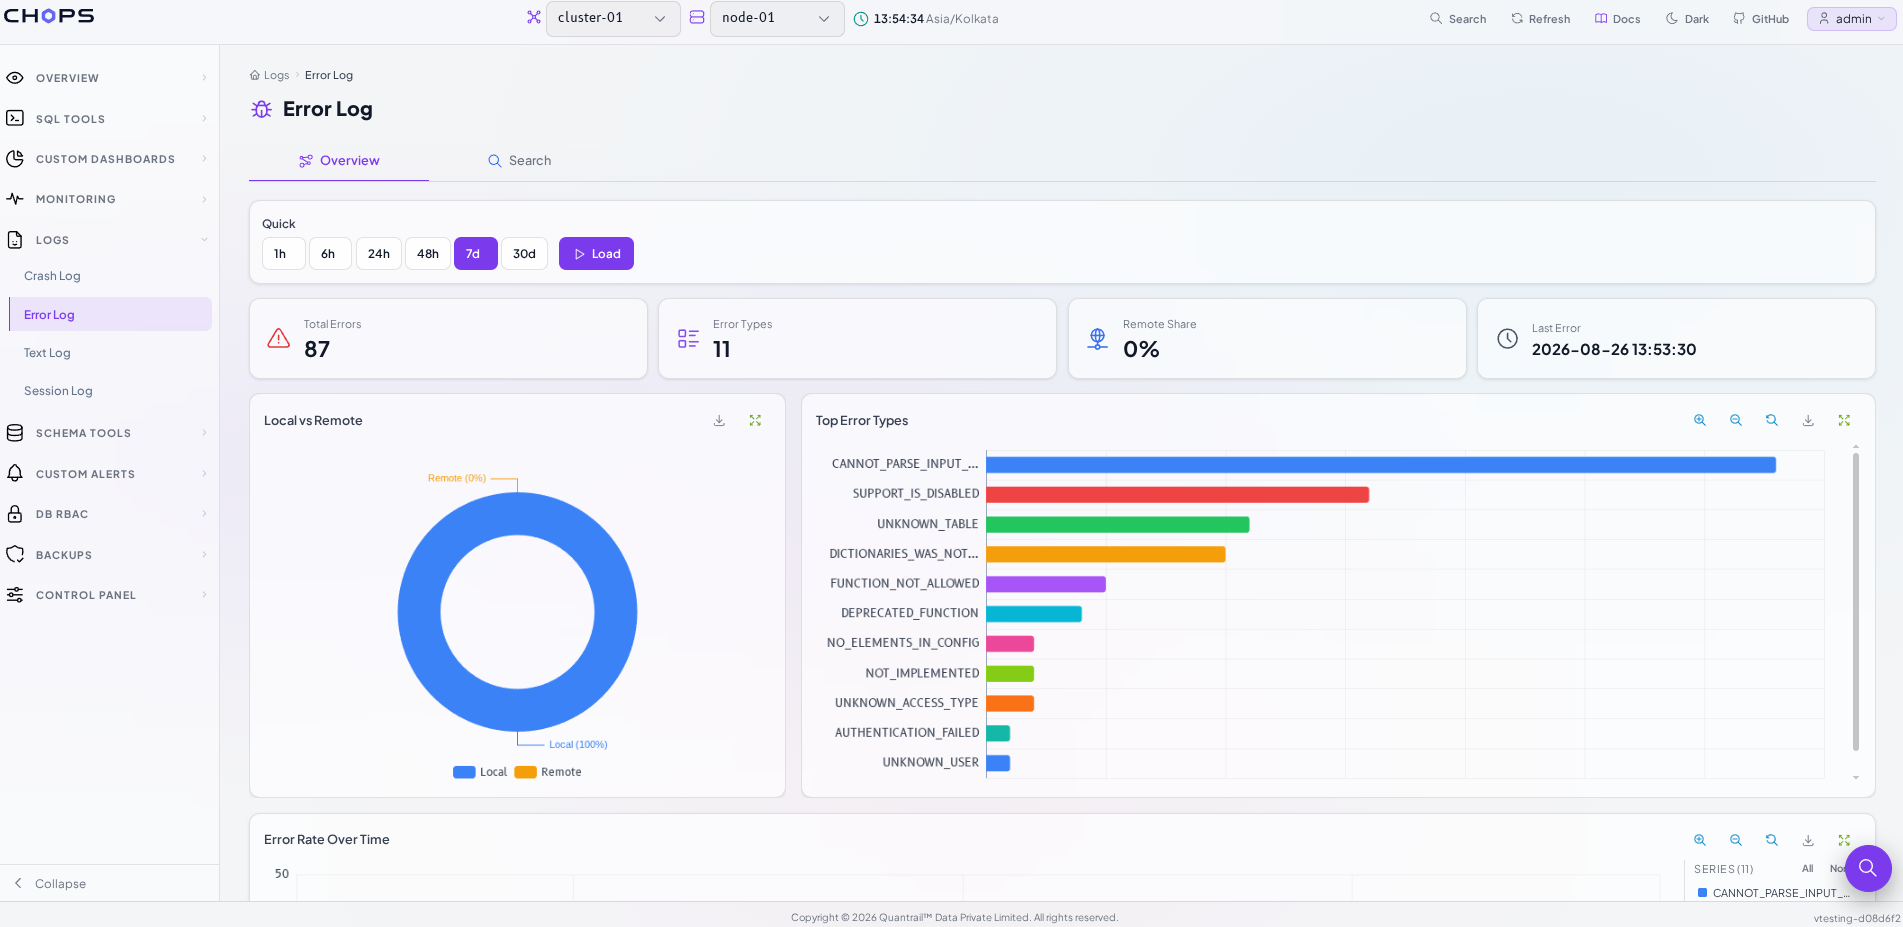
The Top Error Types chart provides a quick starting point. If one type accounts for a large portion of the errors, you can investigate that category further.
Searching Error Logs
The Search view lets you investigate error records without writing SQL. You can select a time range, filter by Error Type, search by Error Message, and set the row limit.
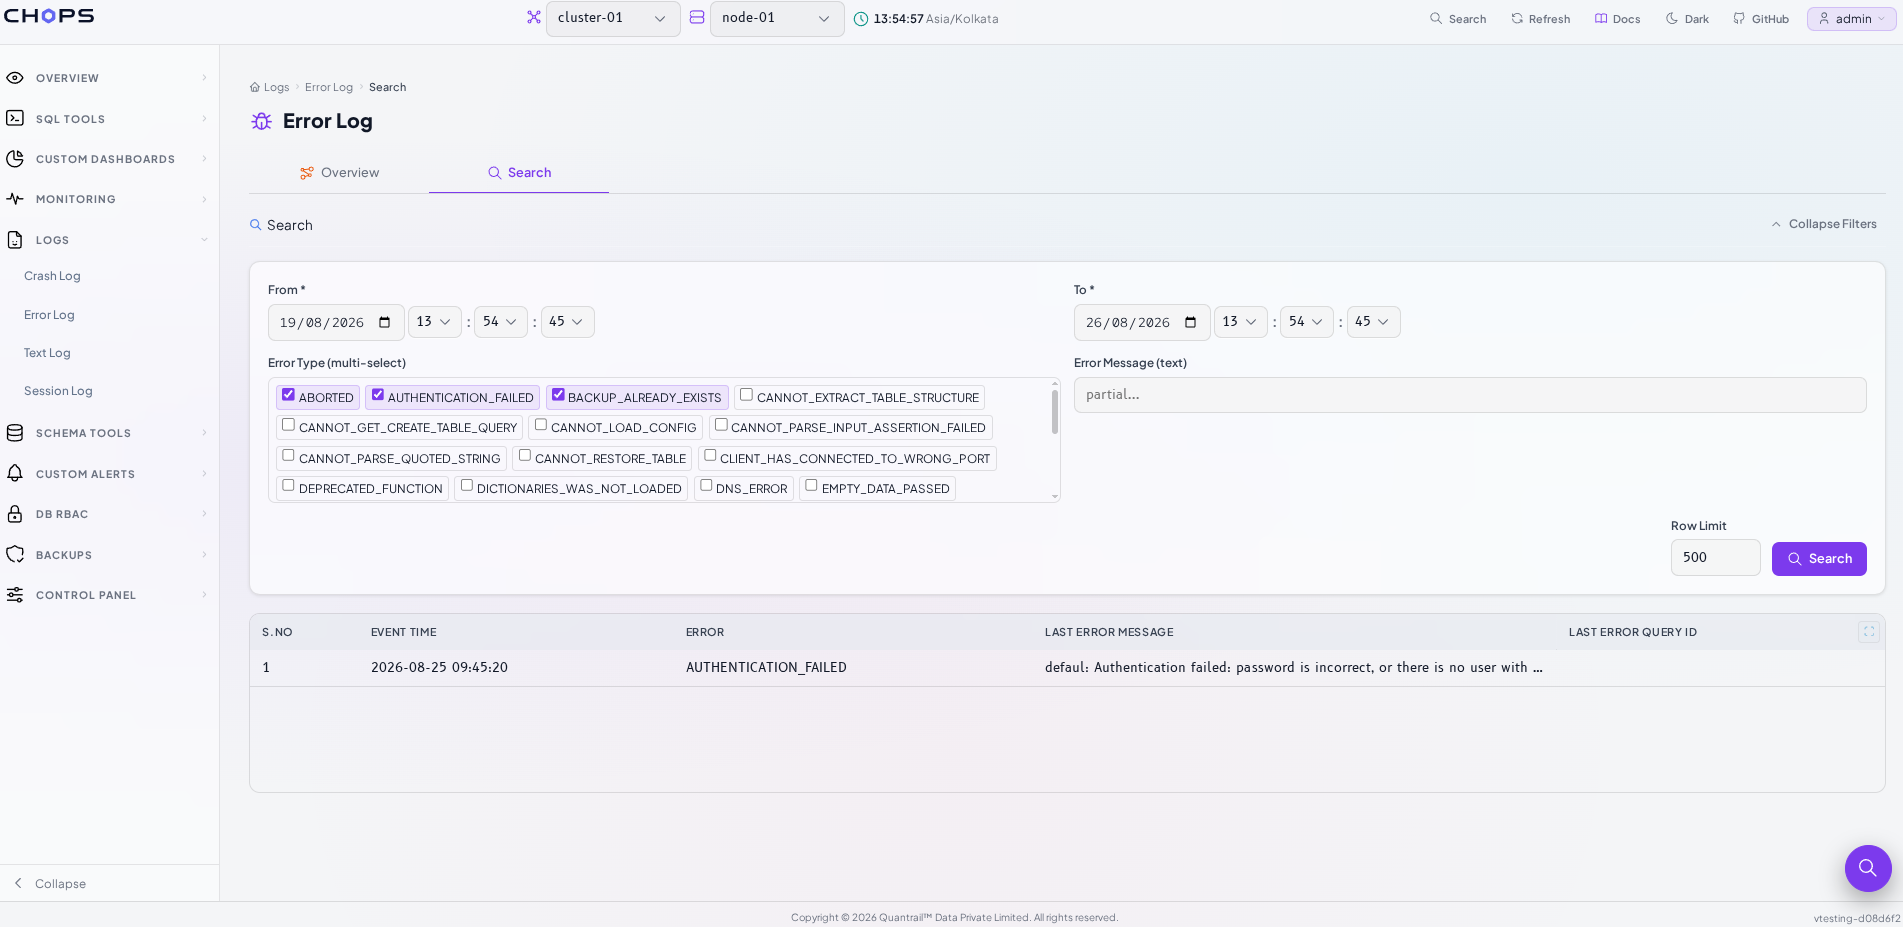
The search results show the matching records along with details such as the event time, error type, error message, and query ID.
3. Text Log: Understanding Server Activity
The Text Log is based on system.text_log and provides a broader view of messages generated by the ClickHouse® server.
Unlike the Error Log, it isn't limited to errors. It includes messages across different log levels, making it useful when something appears unusual but hasn't necessarily resulted in an error.
The Overview provides information such as:
- Total log lines
- Errors
- Warnings
- Number of loggers
- Recent activity
- Log volume by level
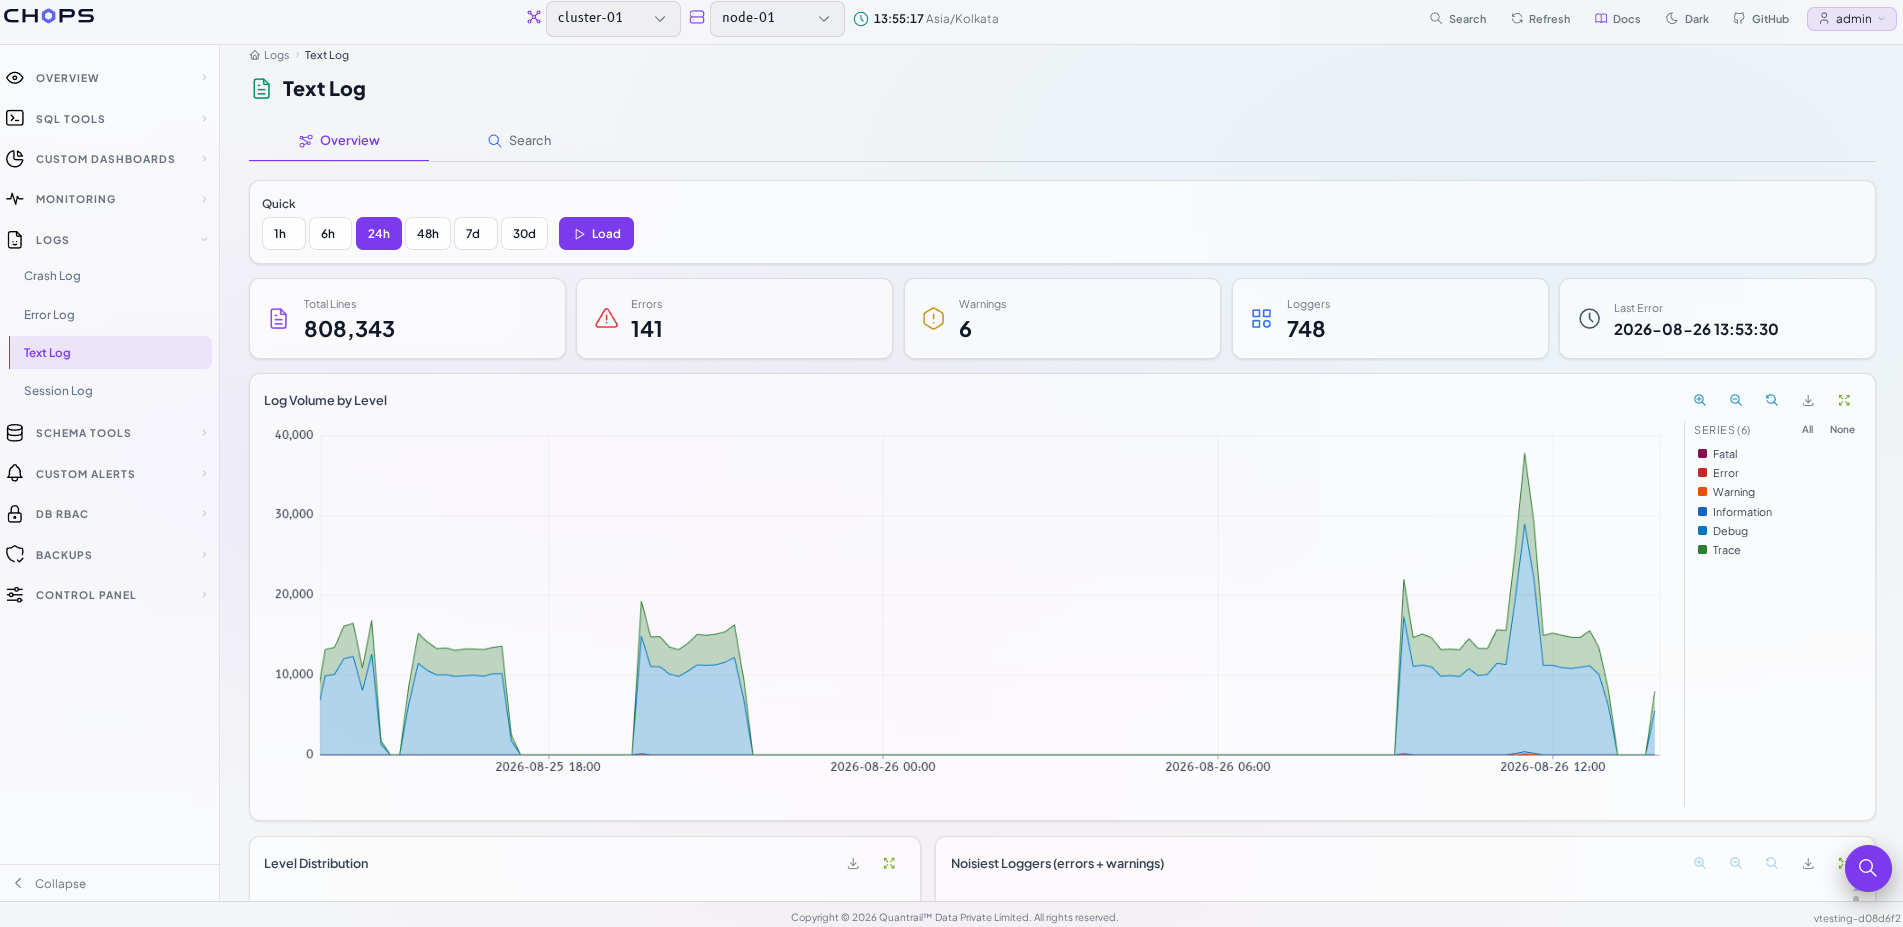
The Log Volume by Level chart provides a quick picture of server activity across the selected period.
Searching Text Logs
When you need to investigate a particular event, switch to the Search tab.
You can filter logs by time range, log level, and message, and set the number of results to display.
The Search view presents the individual log records, including information such as:
- Event time
- Log level
- Query ID
- Logger name
- Message
- Source file and line
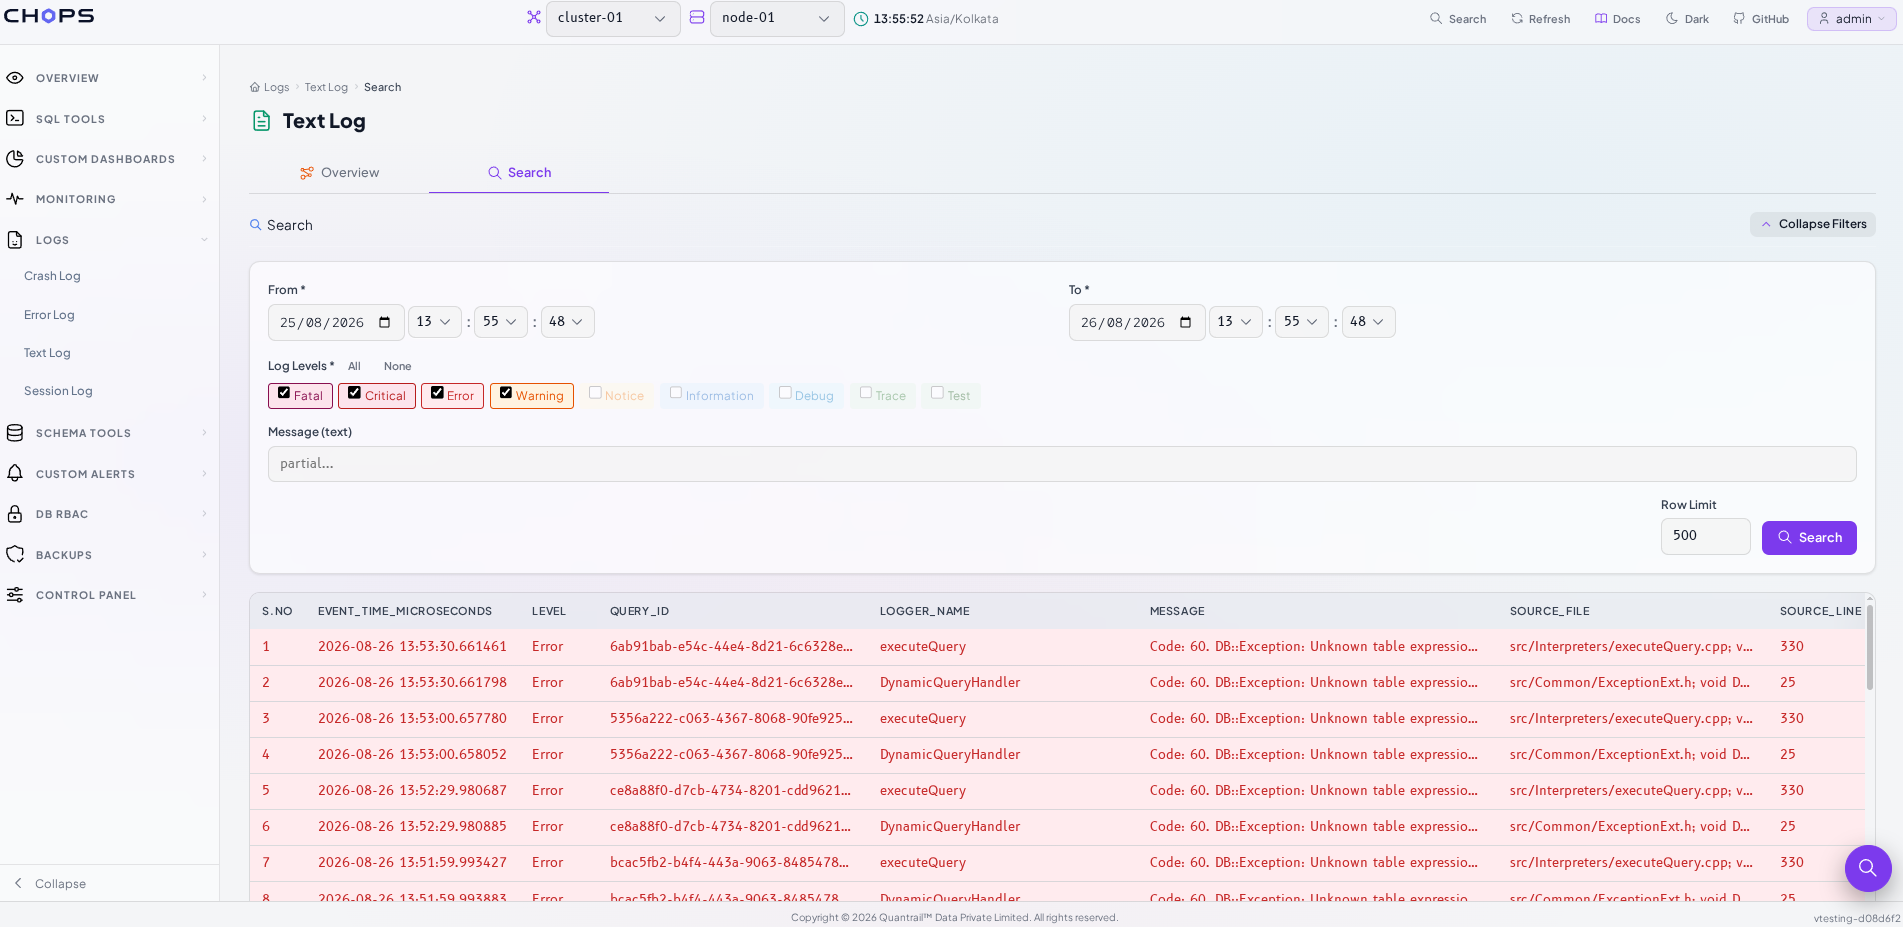
This lets you quickly narrow down relevant server activity and inspect the underlying records without writing SQL against system.text_log.
4. Session Log: Tracking Login Activity
The Session Log is based on system.session_log and provides visibility into login and logout activity.
The Overview summarizes session activity through:
- Total events
- Successful logins
- Failed logins
- Logouts
- Distinct users
- Recent activity
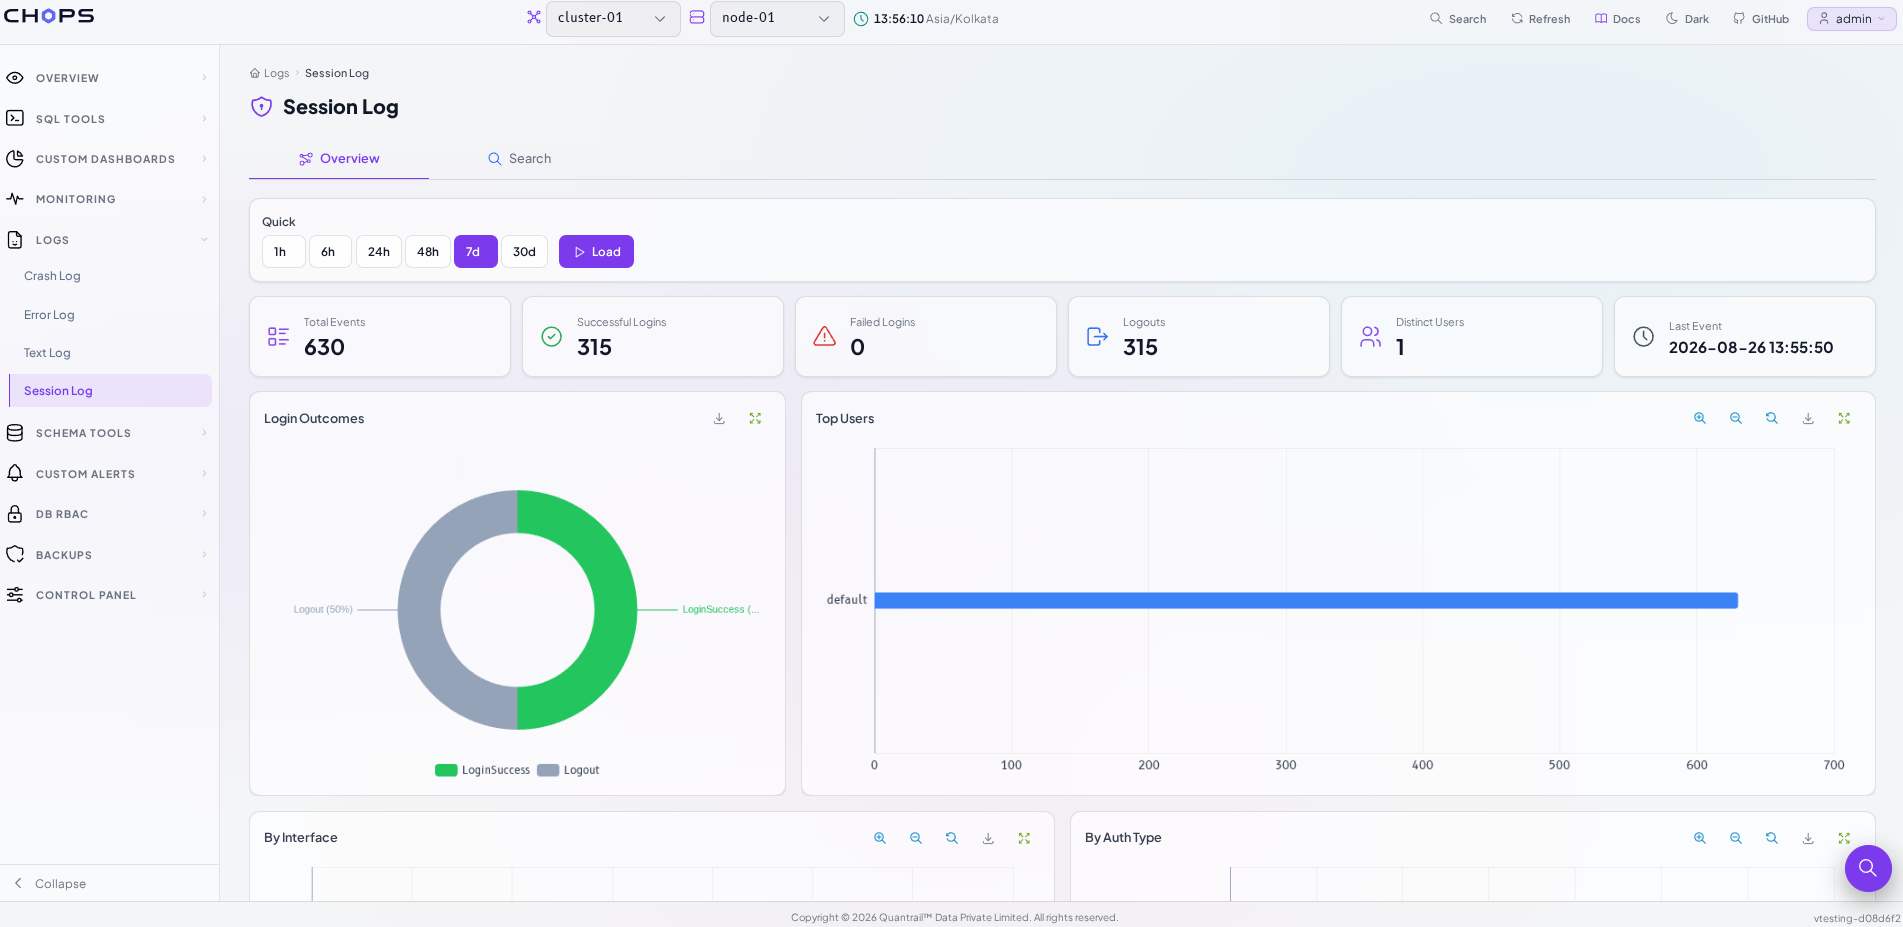
The Login Outcomes chart provides a quick view of successful logins and logouts, while Top Users highlights the accounts generating session activity.
The Search view can be used when you need to investigate specific session activity. You can filter events by event type, user, or failure reason.
This makes it easier to investigate authentication activity directly from CH-Ops without manually querying system.session_log.
From Overview to Search
Across the different log types, CH-Ops follows a simple investigation pattern:
Choose a log → Select a time range → Load the Overview → Identify something interesting → Switch to Search → Investigate the records
The Overview helps you understand the bigger picture, while Search helps you narrow down specific events and investigate the underlying records.
When Should You Use Each Log?
Each log answers a different operational question:
| Log | Useful when you want to know |
|---|---|
| Crash Log | Did the ClickHouse® process crash, and what was recorded? |
| Error Log | What types of errors are occurring, and how frequently? |
| Text Log | What has the ClickHouse® server been reporting about its activity? |
| Session Log | Who has been connecting, and are login attempts succeeding or failing? |
The Overview helps identify the problem, while Search helps investigate it.
From Investigation to Alerts
Logs help you investigate what has already happened. For conditions that require proactive attention, CH-Ops Alert Rules can notify you when defined conditions occur.
The workflow becomes:
Monitor → Detect → Alert → Investigate
Use Alerts to be notified about important conditions, and Logs to investigate the details behind them.
Bringing ClickHouse® Log Investigation Into One Interface
ClickHouse® system logs contain valuable information for monitoring and troubleshooting, but accessing them shouldn't always require writing SQL.
With CH-Ops, you can explore Crash Log, Error Log, Text Log, and Session Log from a single Logs section. The Overview gives you the big picture, while the Search view lets you inspect the underlying records.
Instead of starting every investigation with a SQL query, you can follow a simple visual workflow:
Select the log → Choose the time range → Load the data → Understand the overview → Search the records
This makes ClickHouse® log investigation more accessible and helps you move from identifying an issue to finding the relevant details - without writing SQL for every search.
Explore CH-Ops
Want to learn more about CH-Ops and explore its features? Visit the official website and explore the resources below:
- CH-Ops Official Website
- Getting Started with CH-Ops
- CH-Ops Official GitHub Repository
- CH-Ops Demo Video