What is CHOps?
CHOps is a browser-based operations platform built for managing ClickHouse® deployments. Instead of relying entirely on the command line or HTTP APIs, it provides a unified interface for executing SQL queries, monitoring clusters, managing users, backups, alerts, dashboards, and much more - all from a single web application.
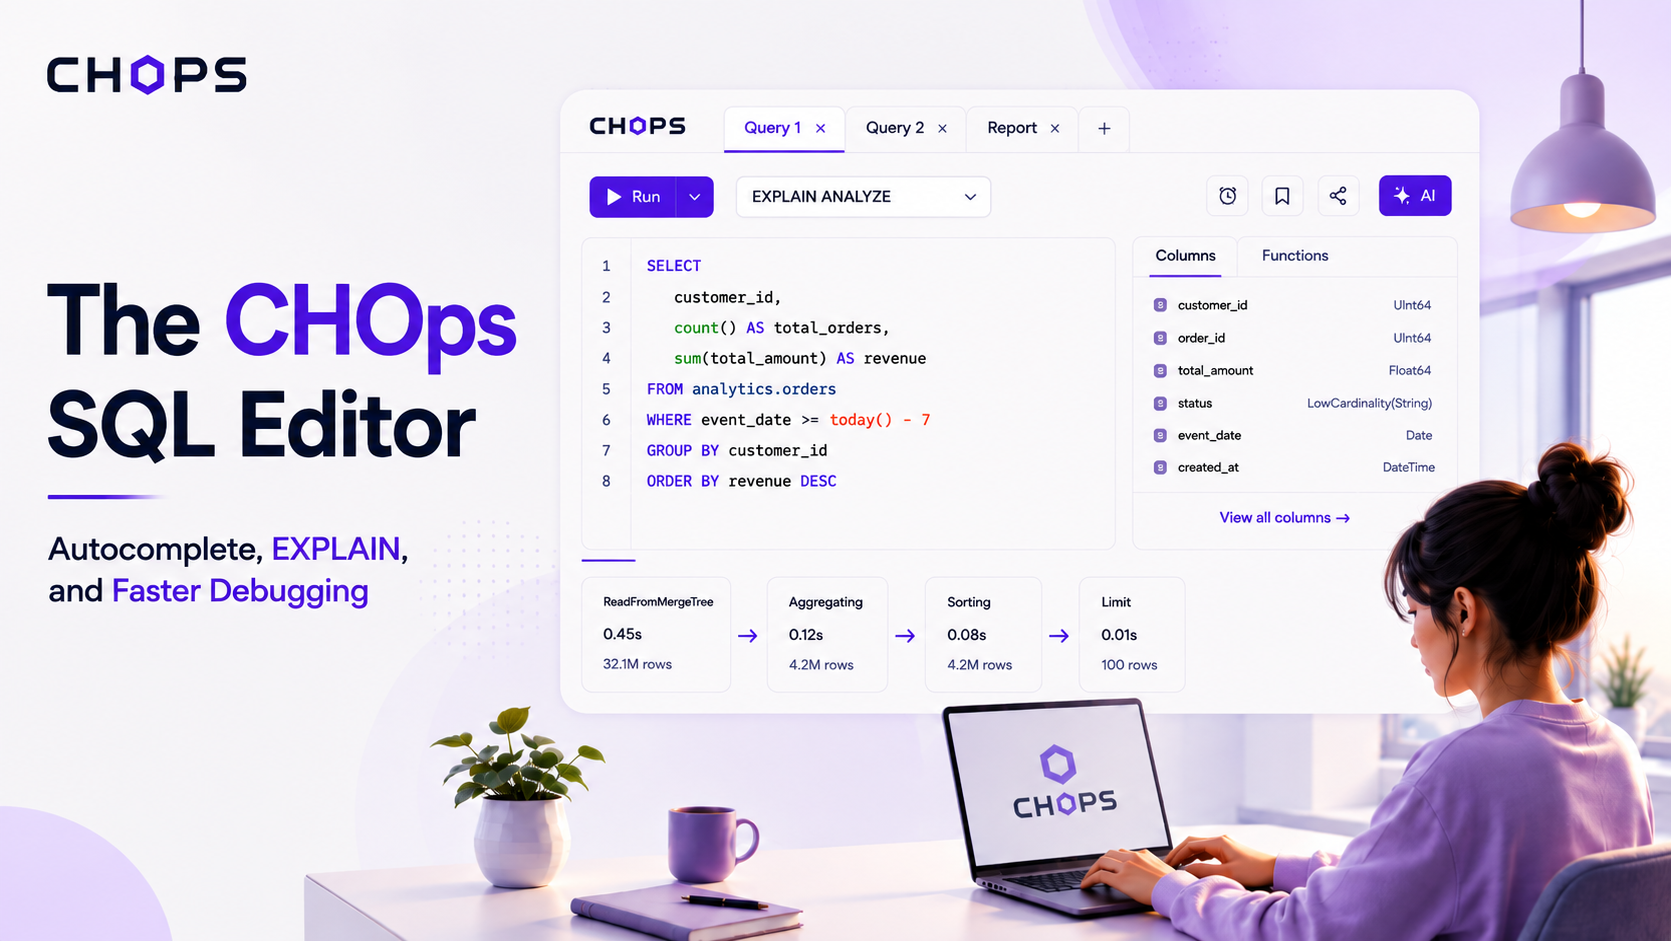
One of its most powerful features is the SQL Editor, designed to simplify the entire query development experience.
Introducing the CHOps SQL Editor
When working with ClickHouse®, writing SQL is only one part of the job. Developers and Data Engineers often spend just as much time browsing schemas, remembering table names, checking execution plans, estimating query costs, and debugging performance issues.
With traditional SQL editors, these tasks usually involve switching between multiple tools or browser tabs. That constant context switching slows development and makes query optimization more difficult.
The CHOps SQL Editor is designed to solve these challenges by bringing everything into a single workspace. Whether you're exploring a new dataset, optimizing analytical queries, or troubleshooting production workloads, this editor provides all the tools needed to build, analyze, and optimize queries without leaving the page.
Let's explore how these features streamline the ClickHouse® query development workflow and performance.
The SQL Editor at a Glance
The SQL Editor is organized into four main areas, each designed for a specific part of the query workflow.
- Left: Schema Explorer for browsing databases and tables.
- Top of the center: Query Tabs for working on multiple queries simultaneously.
- Center: The SQL Editor and its toolbar where you write SQL, choose how to run it, and reach the history, bookmarks, share, export, fullscreen, and AI controls.
- Bottom: The Results Panel for viewing results, execution statistics, and debugging information.
This layout keeps everything within reach, eliminating the need to jump between multiple applications while developing queries.
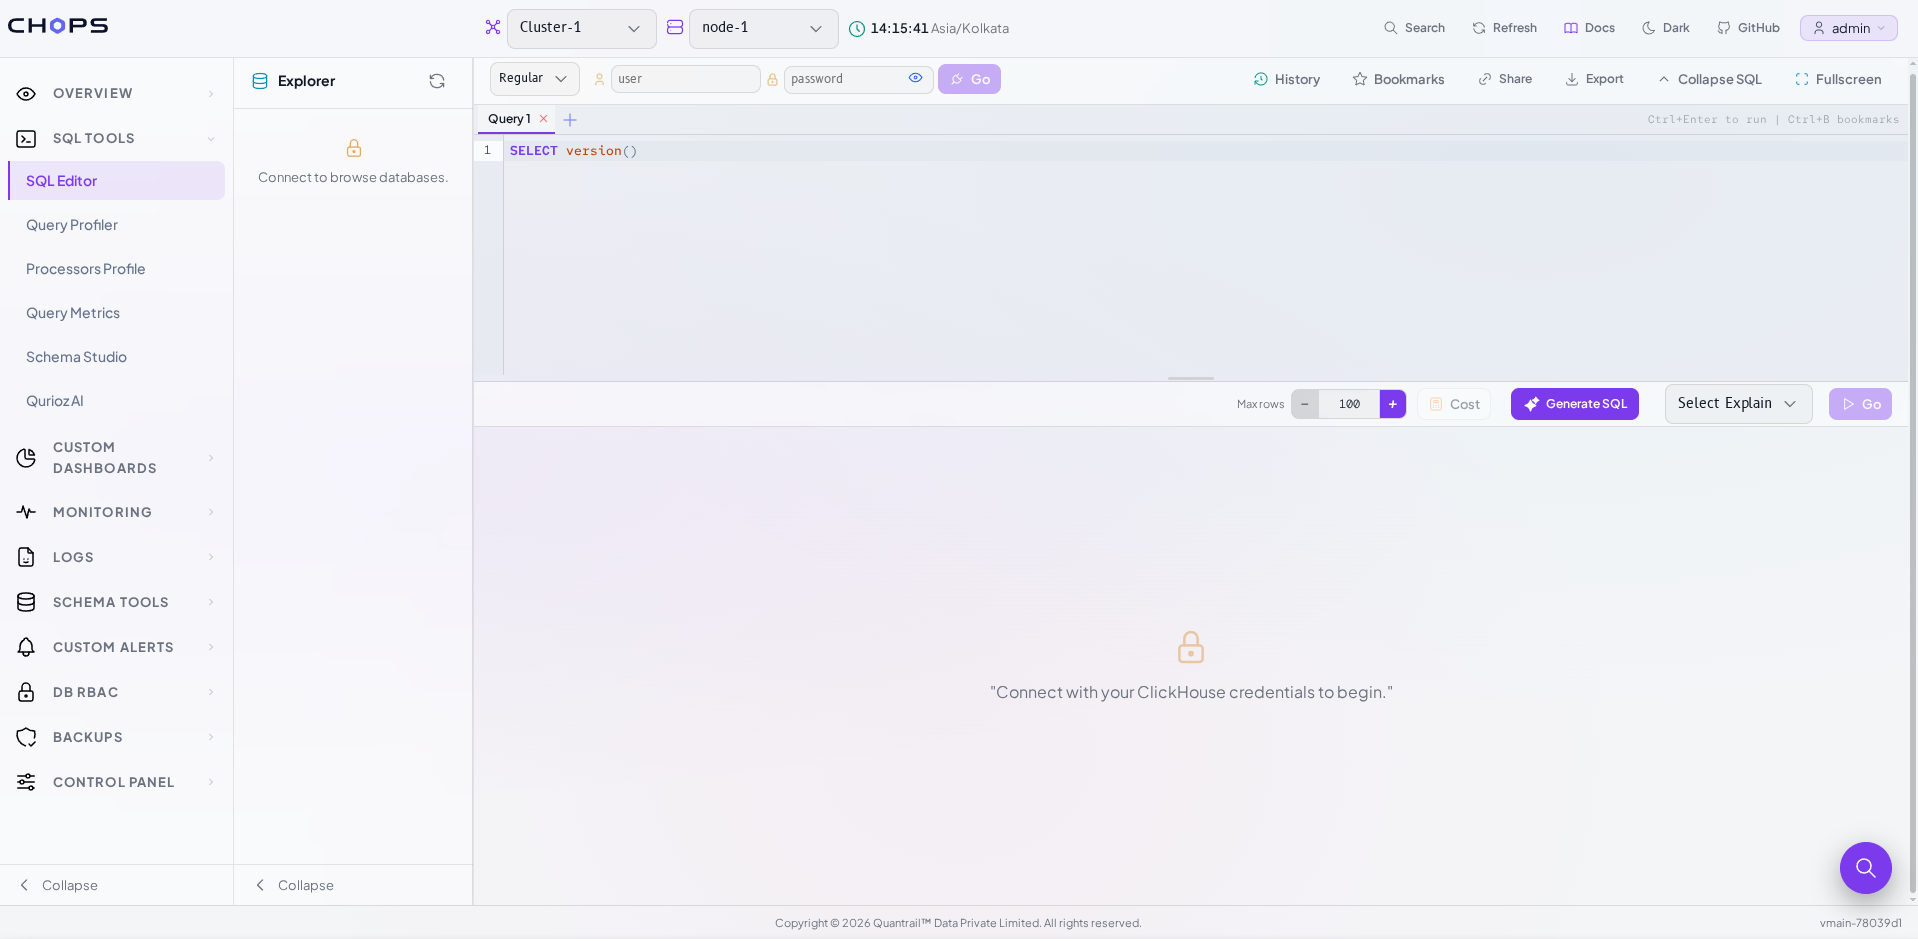 CHOps SQL Editor layout
Connecting First
The SQL Editor allows direct authentication using ClickHouse® credentials.
Simply enter your:
- Username
- Password
Once authenticated, the SQL editor connects securely and unlocks schema browsing, query execution, and analysis features. This design separates application login from database authentication, improving security and flexibility.
Built-in Database Explorer
Once connected, the first place you'll likely visit is the Schema Explorer.
The Schema Explorer lets you browse your ClickHouse® databases and tables directly from the left panel. Expand a database to view its tables, then select a table to insert its fully qualified name into the SQL editor.
Need to check the table structure first? The code icon beside each table opens its complete CREATE TABLE statement, making it easy to review columns, sorting keys, and table engines without leaving the editor.
For databases where AI assistance is needed, the sparkles icon provides quick access to AI SQL generation. We'll explore that workflow later in Generating SQL with AI.
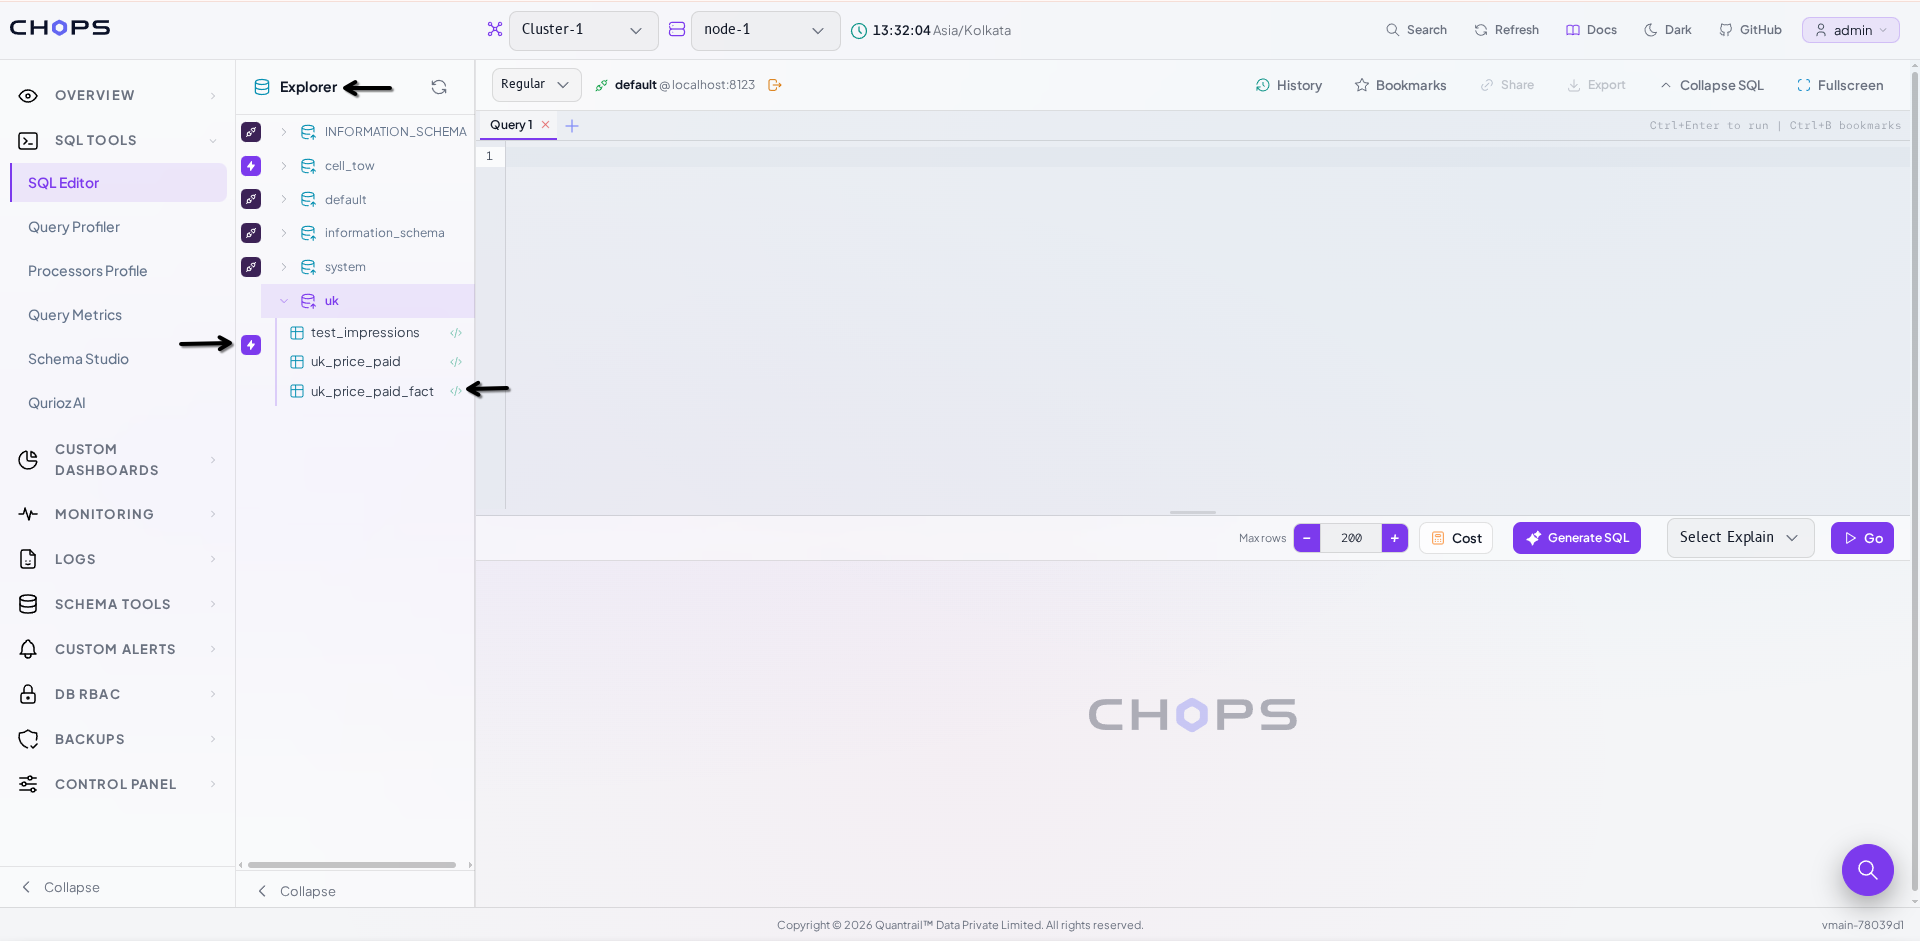 CHOps schema explorer showing databases and tables
Smart SQL Autocomplete
One of the biggest productivity boosters of the SQL Editor is Autocomplete.
As you type:
SELECTthe editor automatically suggests:
- SQL keywords
- ClickHouse® functions
- Database names
- Table names
- Column names
Unlike a generic SQL editor, these suggestions come directly from your connected ClickHouse® cluster. Instead of showing generic SQL objects, the editor suggests only the databases, tables, functions, and columns that actually exist on your server.
Autocomplete reduces syntax mistakes while making query writing significantly faster.
Example
Instead of remembering:
SELECT *
FROM sales.customer_transactions_archive
you simply type:
SELECT *
FROM sales.
and choose the required table from the suggestion list.
Autocomplete also displays function signatures and descriptions, making it much easier to discover ClickHouse® functions without switching to external documentation.
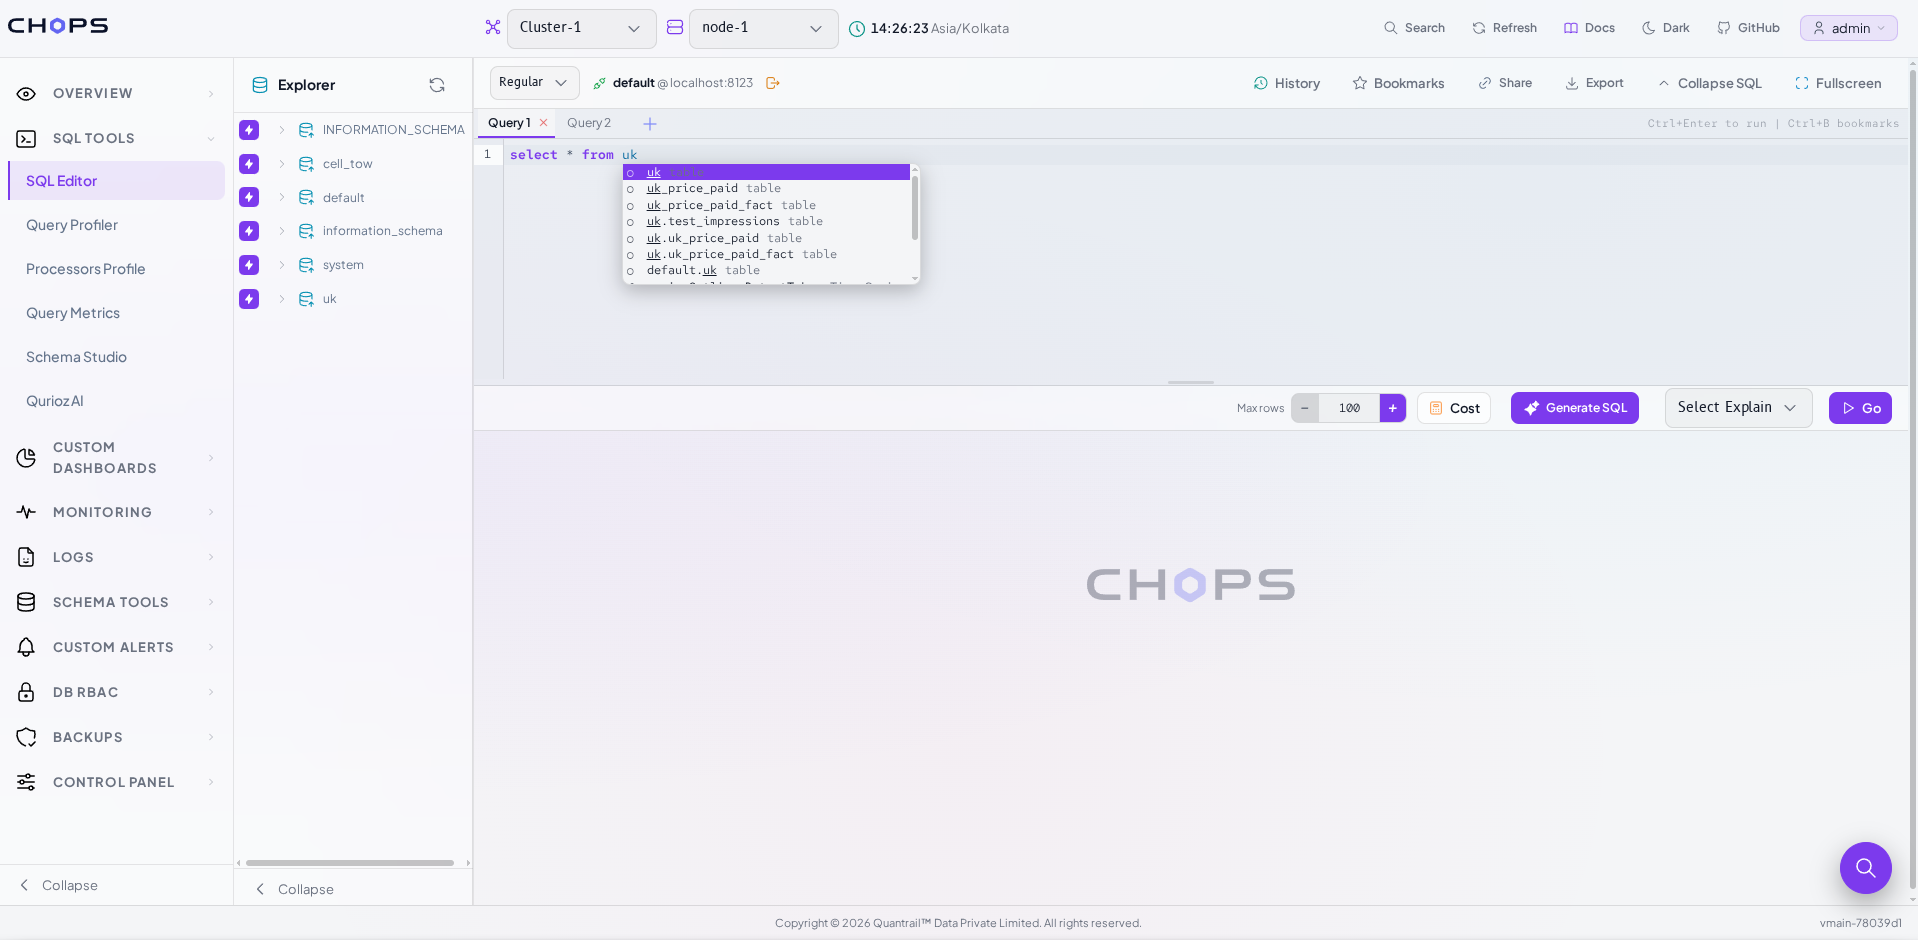 SQL autocomplete suggestions in CHOps editor
Running Your Query
Once your query is ready, executing it is straightforward.
Simply click Go, or use Ctrl + Enter.
The action performed depends on the selected execution mode. You can either execute the SQL directly or choose one of the available EXPLAIN modes to analyze the query before running it.
Understand Queries with EXPLAIN
Understanding how ClickHouse® executes a query is often more valuable than simply seeing the result.
Normally, checking a query plan requires manually prefixing every query with EXPLAIN, executing it, reviewing the output, and then removing the prefix before running the actual query.
The CHOps SQL Editor simplifies this workflow. Simply select an EXPLAIN mode from the dropdown beside the Go button and execute the query. No query rewriting is required.
| Explain mode | What it shows |
|---|---|
| Explain & Explain plan | Displays the execution plan in order |
| Explain syntax | Your query after ClickHouse®'s internal rewrites |
| Explain query tree | The analyzed, internal form of the query |
| Explain pipeline | The actual processors that will do the work |
| Explain estimate | Estimated rows, parts, and marks to be read |
| Explain AST (graph) | Visualizes the parsed query structure |
| Explain pipeline (graph) | Displays the execution pipeline as an interactive graph |
| Explain plan (JSON) | Returns the execution plan in JSON format |
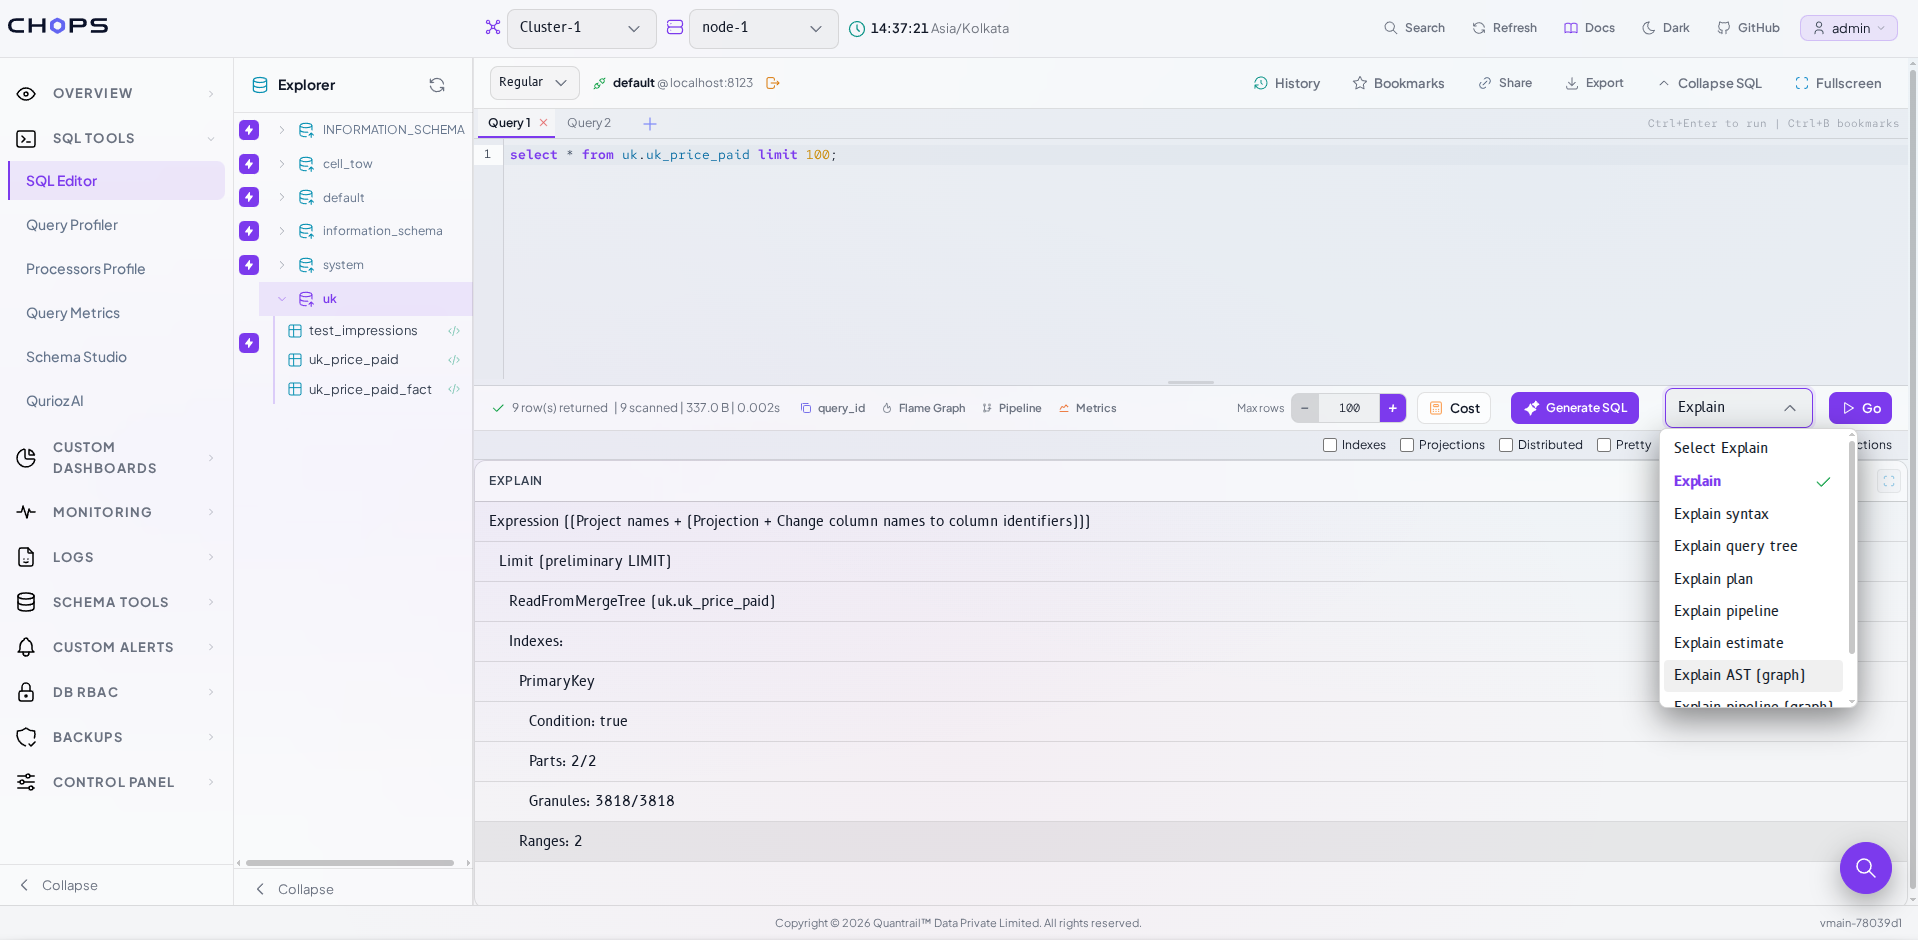 EXPLAIN mode dropdown in CHOps SQL Editor
AI-Powered SQL Generation
Not every query needs to start from scratch. Sometimes you know what information you need but not the exact SQL syntax.
The Generate SQL feature helps convert natural language into SQL queries.
Example prompt:
Show the top 10 products by revenue during the last month.
The generated SQL can then be reviewed, modified, and executed like any manually written query, making it useful for rapid prototyping and learning new schemas.
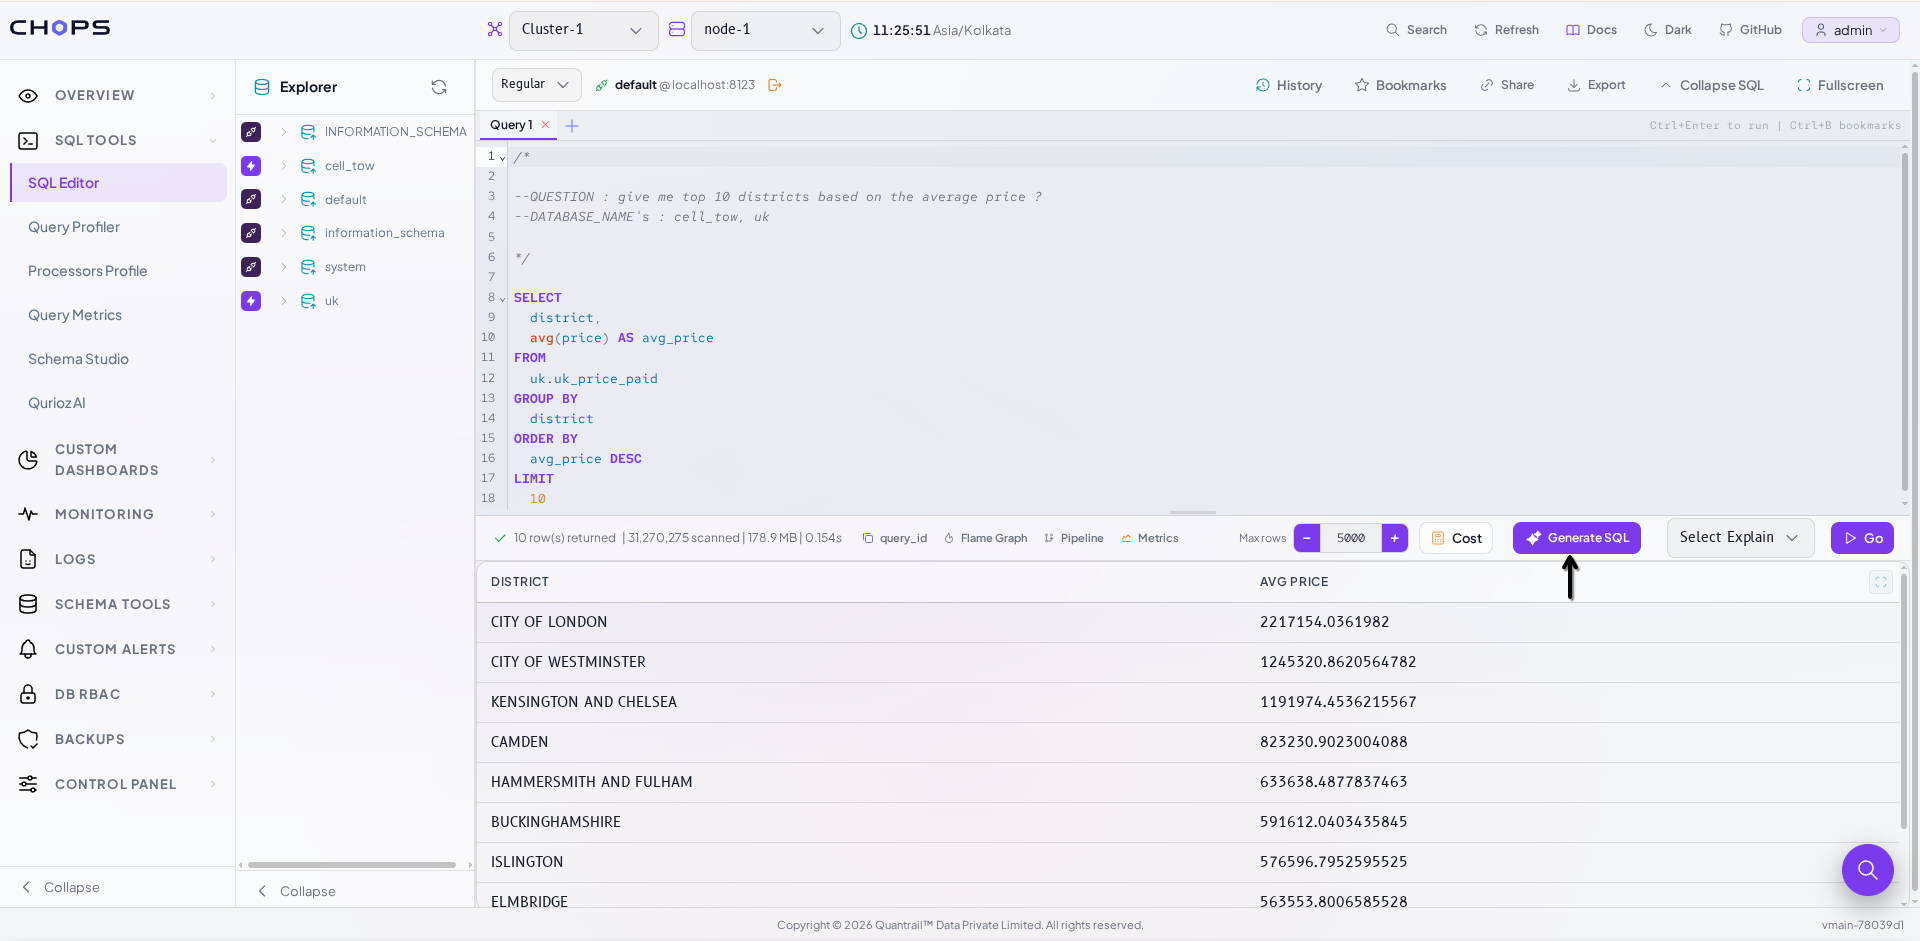 AI-generated SQL from natural language prompt
The Debugging Tools Around the Query
A few smaller features exist specifically to shorten the time between "something feels slow" and "here is why":
Estimate Query Cost
Before executing an expensive query, it's often useful to understand how much work ClickHouse® is expected to perform.
The Cost feature estimates: rows to be read, parts to be scanned, marks to be processed, and available indexes without actually executing the query. This provides a quick way to identify potentially expensive queries before they impact your cluster.
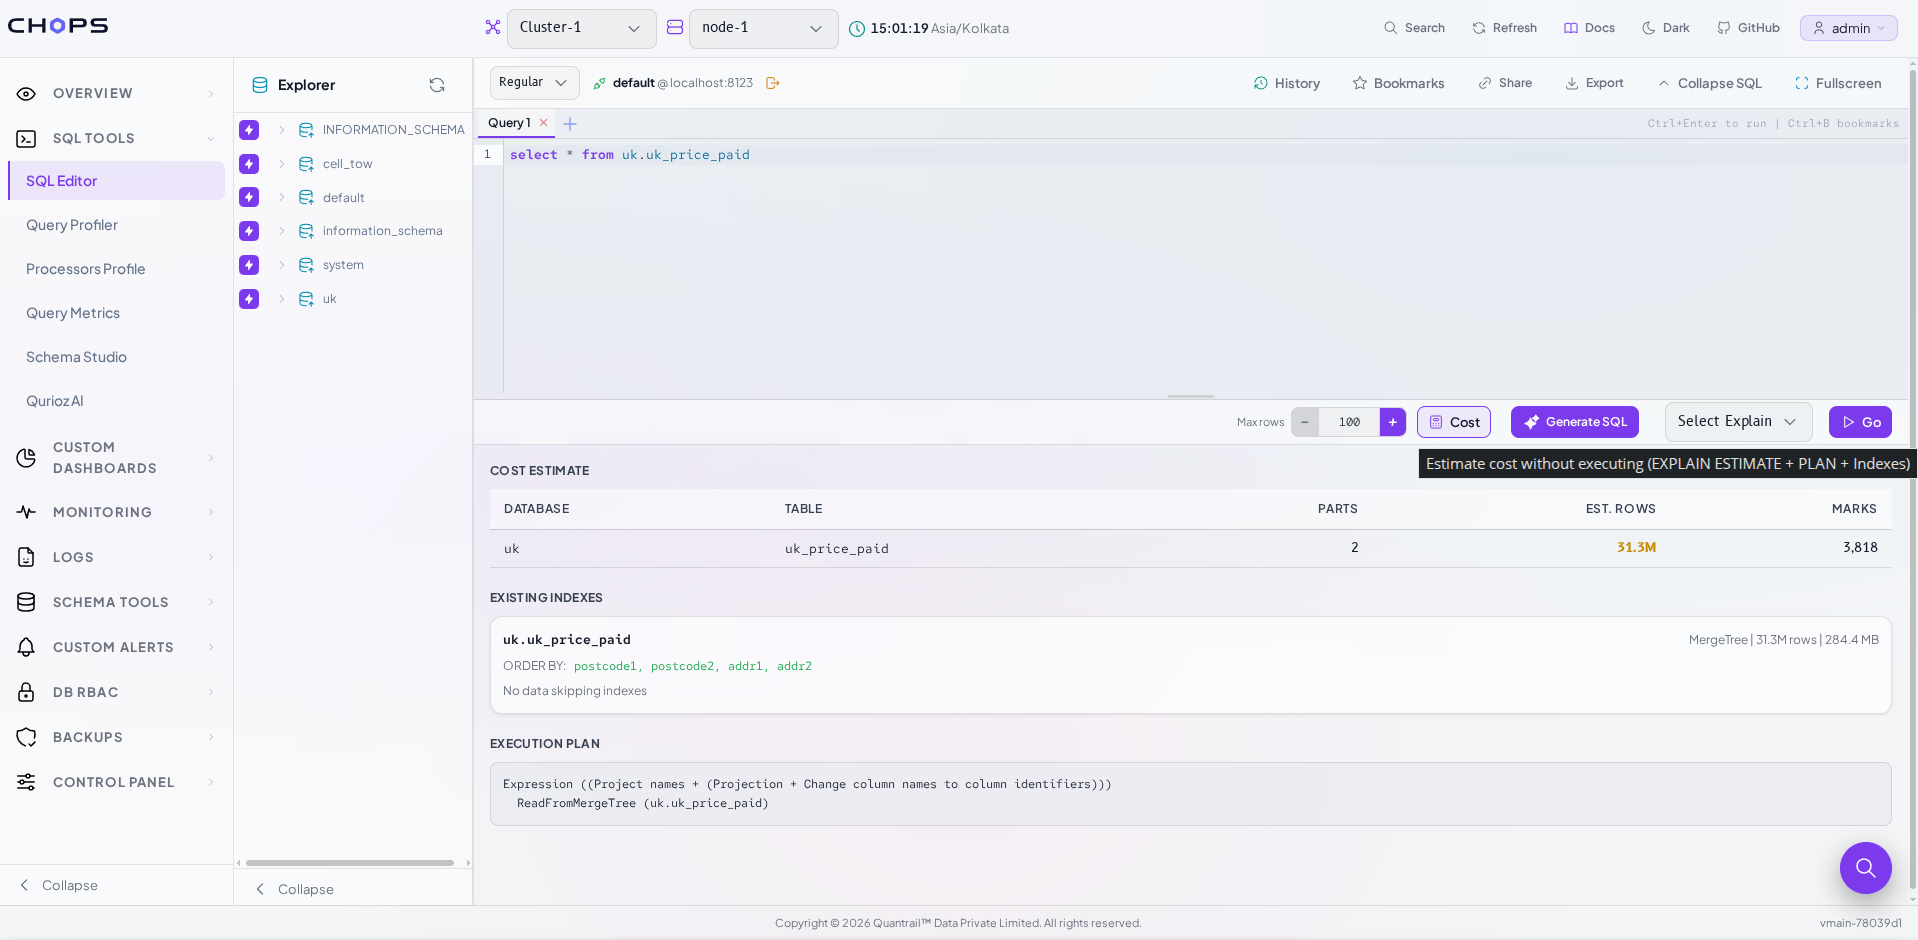 Query cost estimation panel
Max Rows Control
Max Rows caps how many rows come back to the browser, so an accidental unbounded query does not lock up the tab while you are trying to debug something else.
When larger datasets are required, the limit can be adjusted or the results can be exported instead.
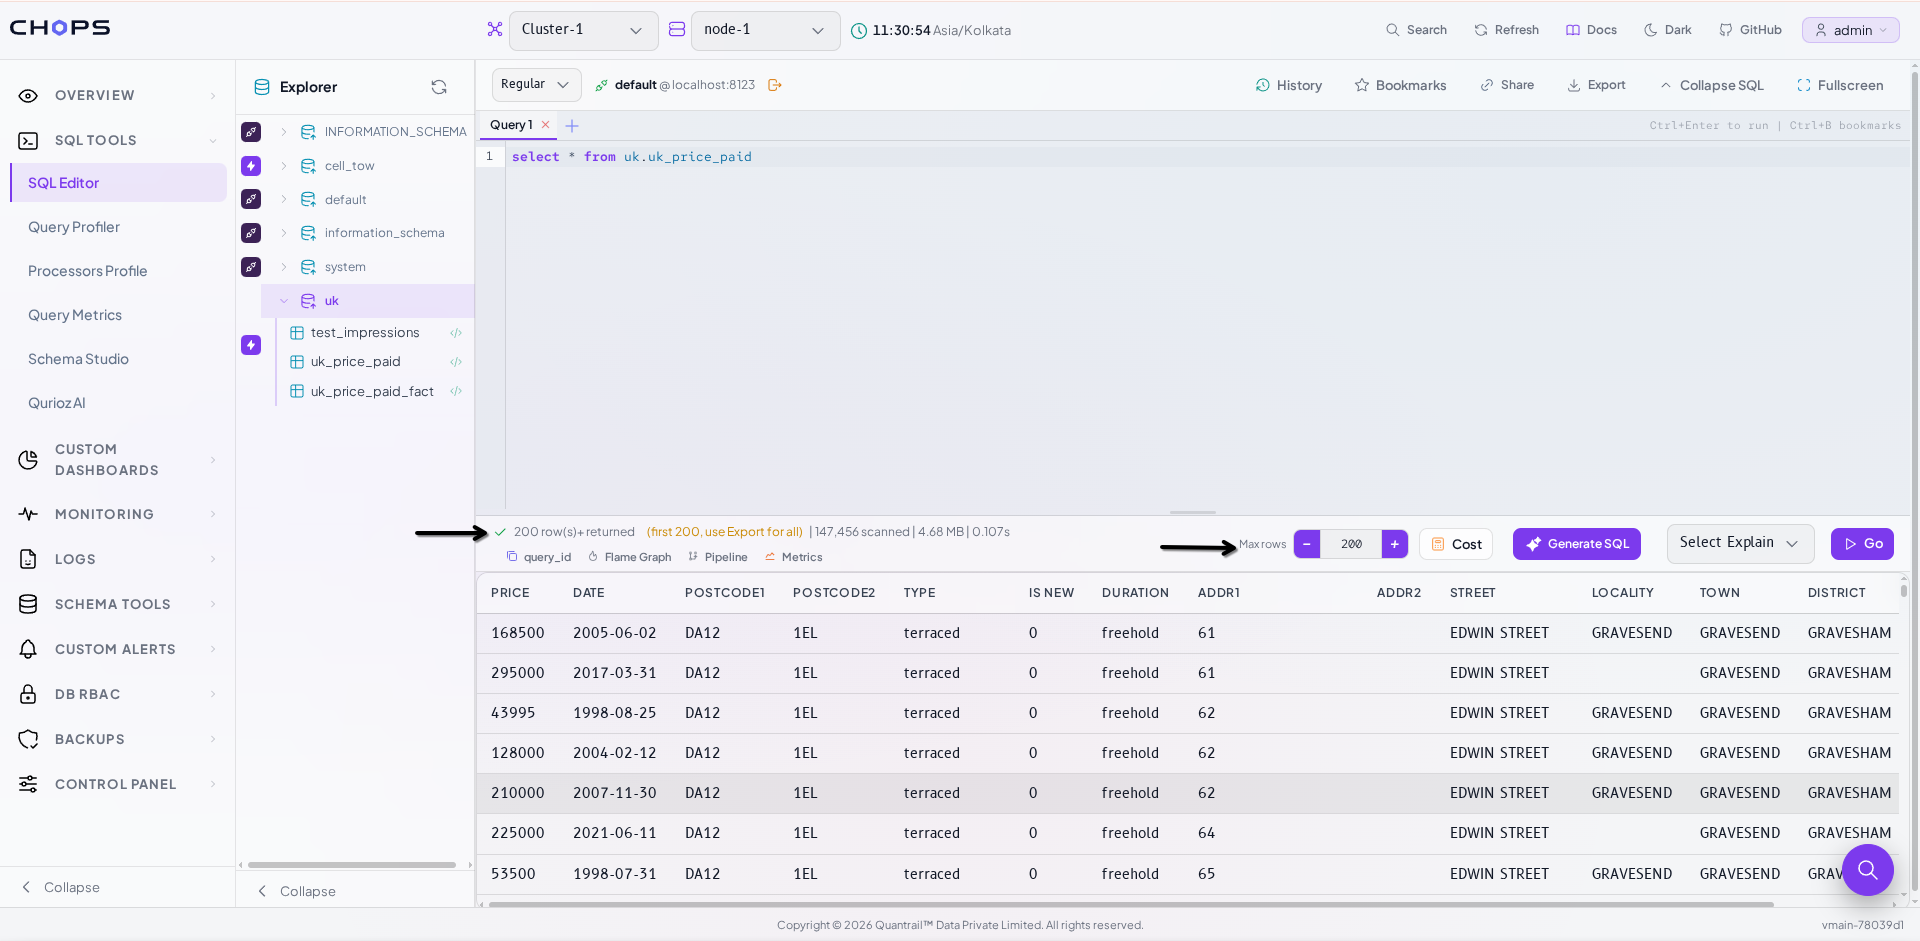 4M-row table, showing only 200 rows without a query-level LIMIT
Action Buttons After a Run
Once a query finishes and ClickHouse® has assigned it a query ID, a row of buttons appears in the statistics bar to take you straight into the profiling tools for that exact query:
- Query_id: copies ClickHouse®'s ID for the query to your clipboard, useful for looking it up in system tables or handing to whoever administers the cluster.
- Flame Graph: opens the Query Profiler with this query loaded, showing where it spent its time. Reach for this first when something is slow.
- Pipeline: opens the Processors Profile with the query loaded, rendering its execution as a diagram so you can see which step dominated.
- Metrics: opens Query Metrics with the query loaded, showing a second-by-second view of how it used resources while it ran.
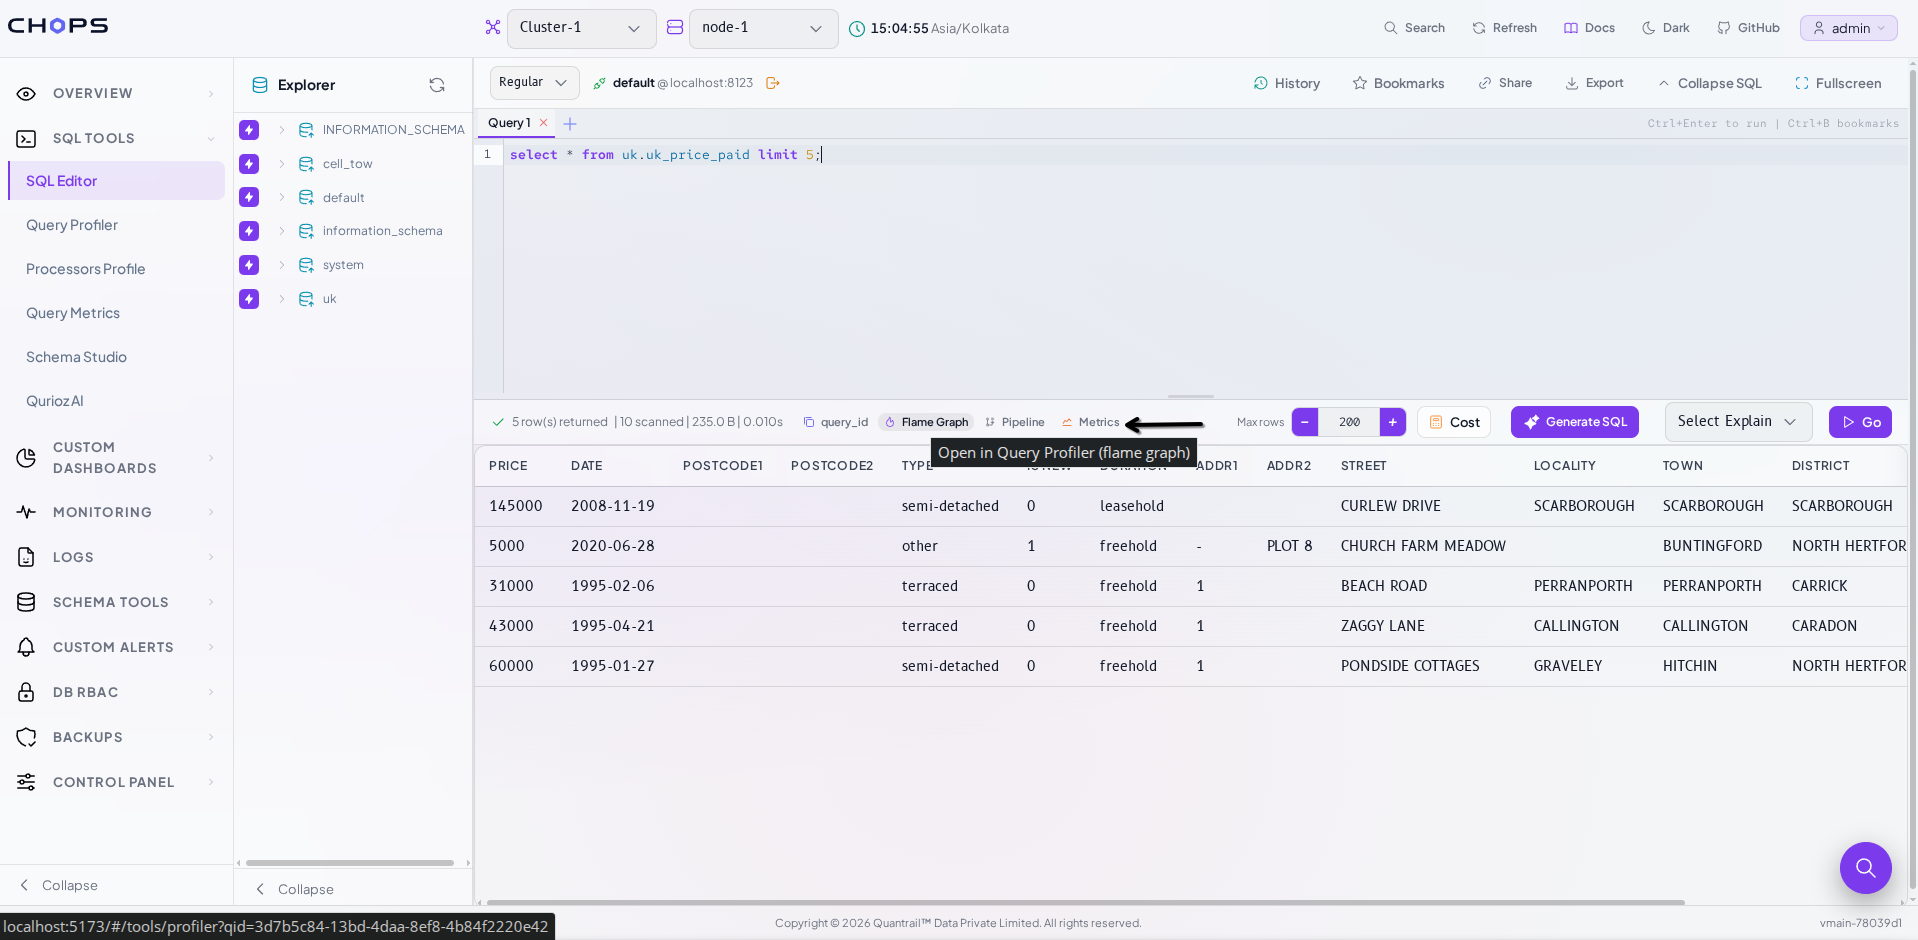 Quick actions for analyzing and managing query results
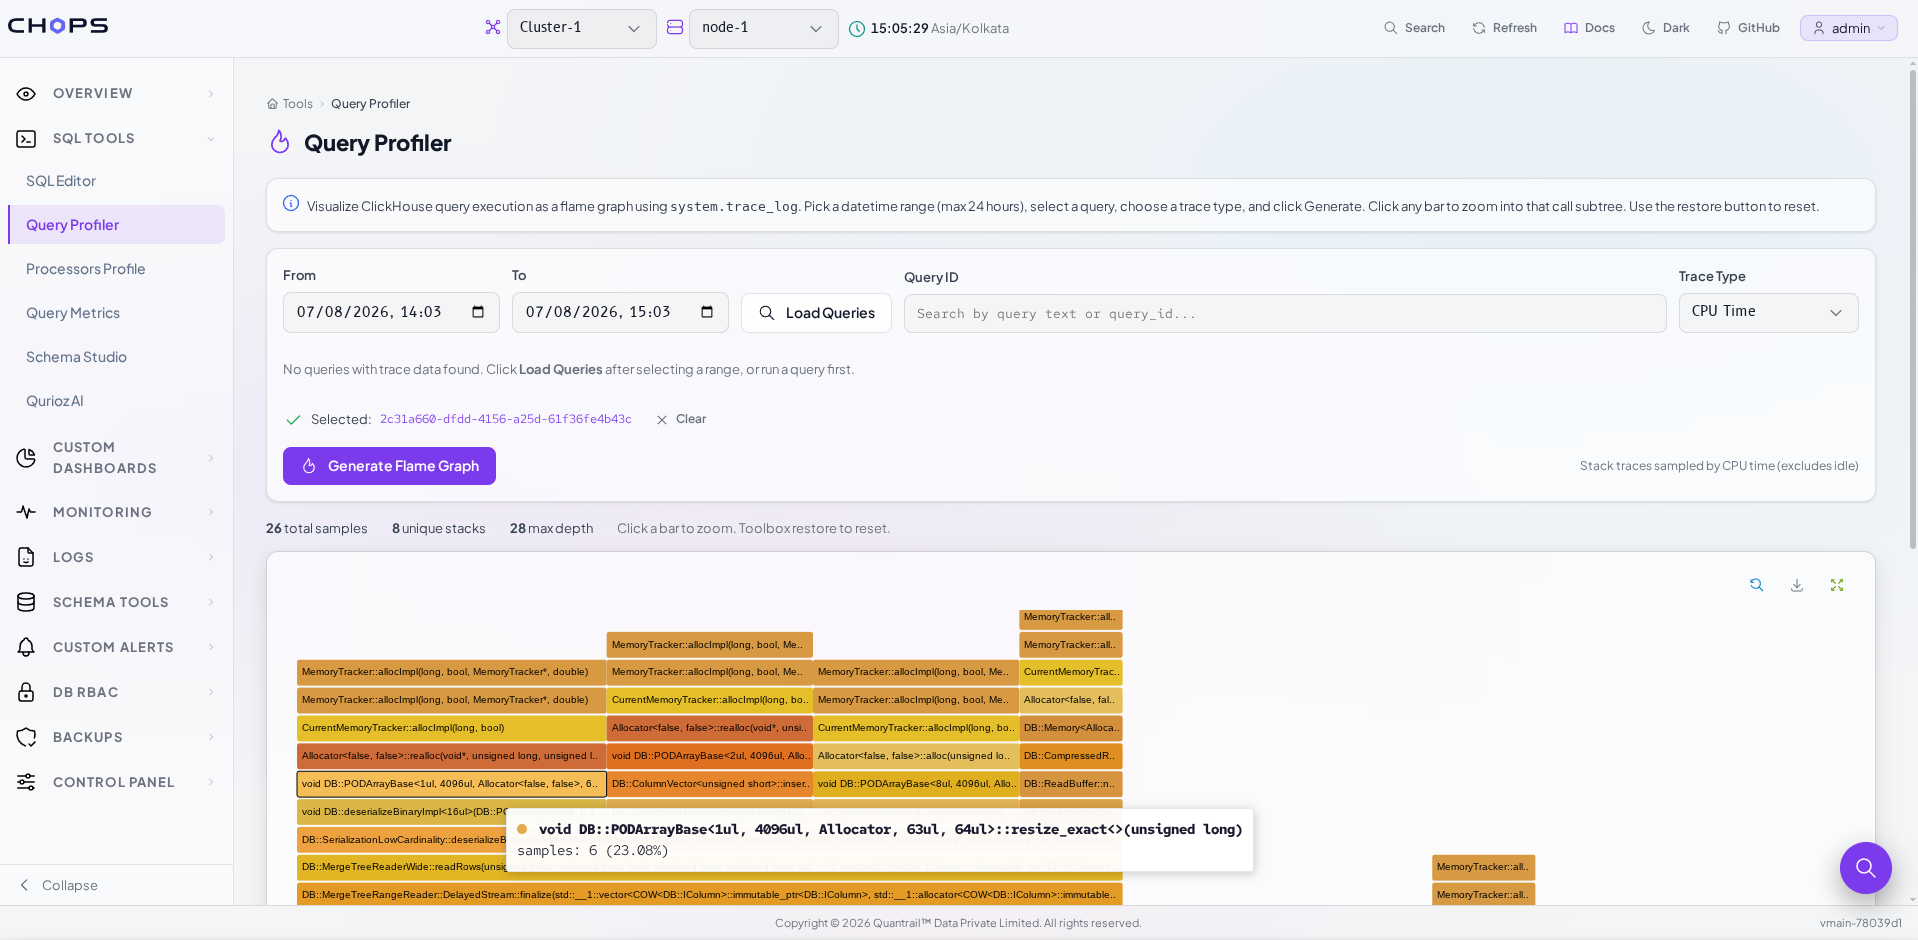 Analyze query execution with the Query Profiler
History
Keeps every query you have run, with its timing and success or failure. Instead of rewriting or searching through old SQL files, you can quickly reopen previous queries, review execution results, and continue where you left off.
History keeps your most recent queries and drops the oldest as new ones arrive. The Clear button empties it.
Bookmarks
Some queries become part of your daily workflow. Bookmarks let you save the ones you check often, like a recurring health check query, so you are not retyping the same debugging query every day.
Share Option
Need a second opinion on a query?
The Share feature generates a link containing the current SQL, allowing teammates to open the query directly in their own SQL Editor.Since every user reconnects using their own ClickHouse® credentials, sharing a query never grants access to your database, it simply shares the SQL itself.
Compare Query Performance
Next to the connect control is a second switch: Regular and Comparison. Regular is the single query view described above. Comparison splits the screen into a current query on the left and an experimental rewrite on the right, each with its own cost estimate and run button.
This is the mode built for tuning. Paste the slow query on one side, write a rewrite on the other, and check whether the rewrite actually reduces estimated cost before you touch production.
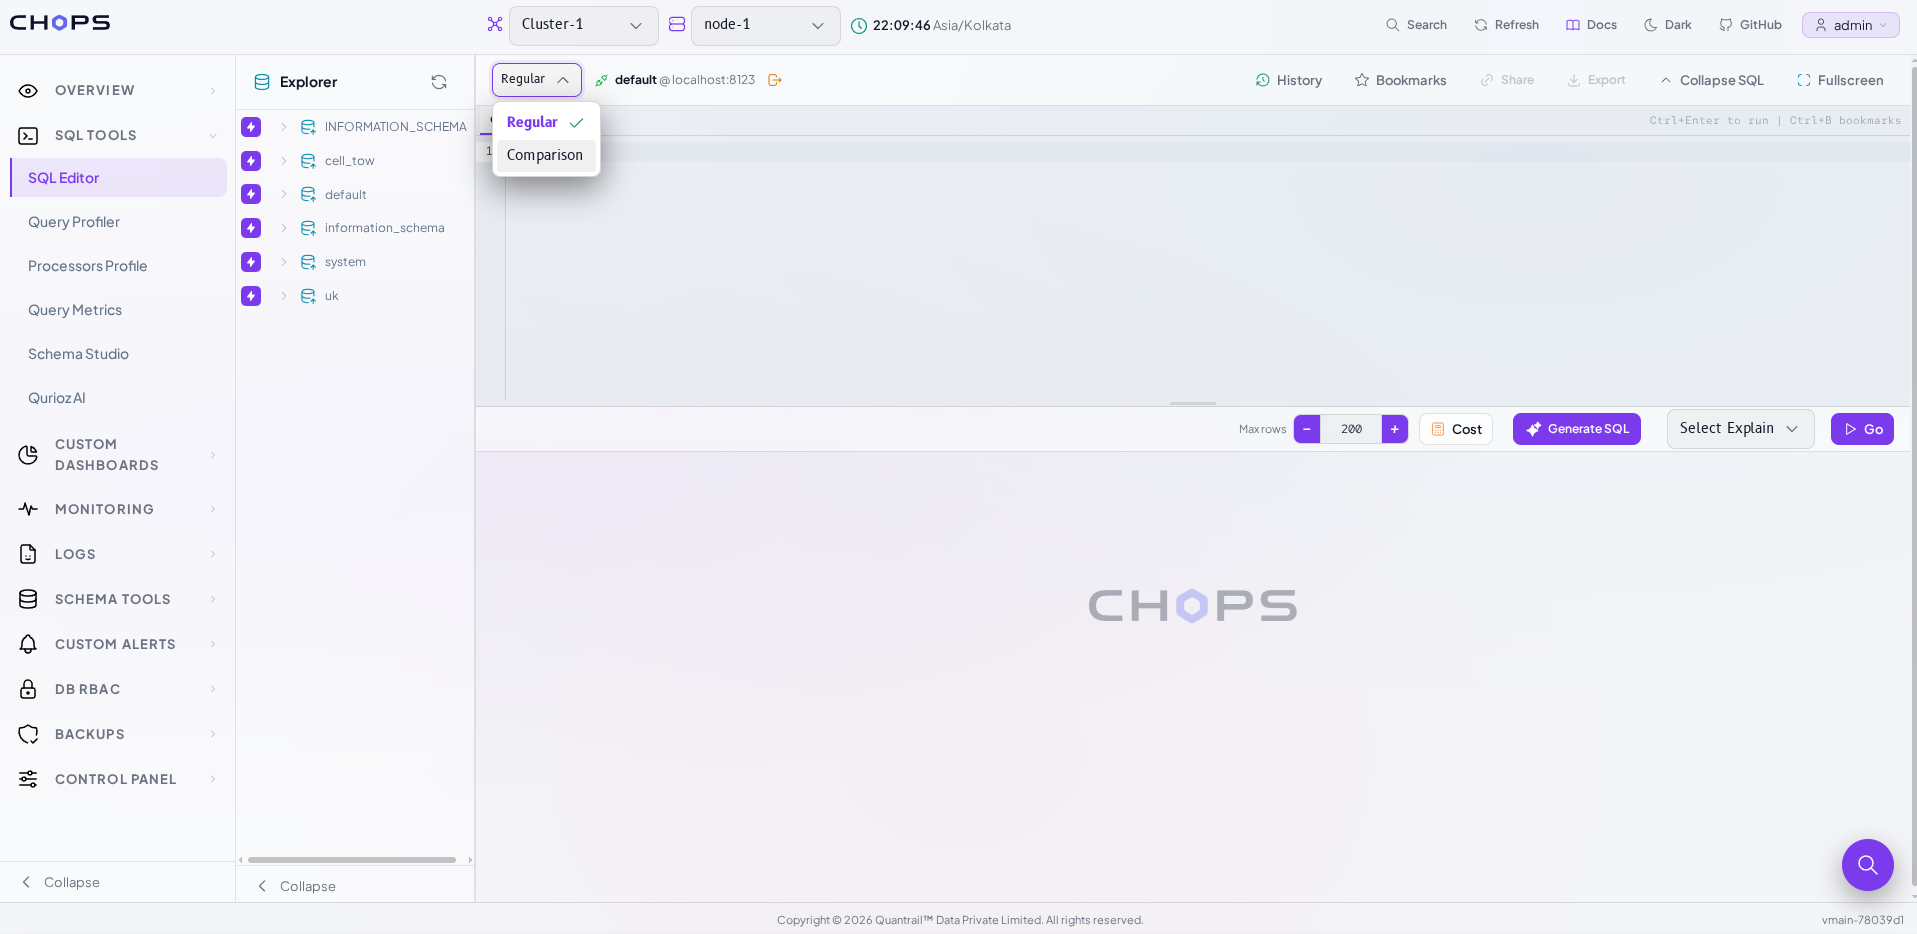
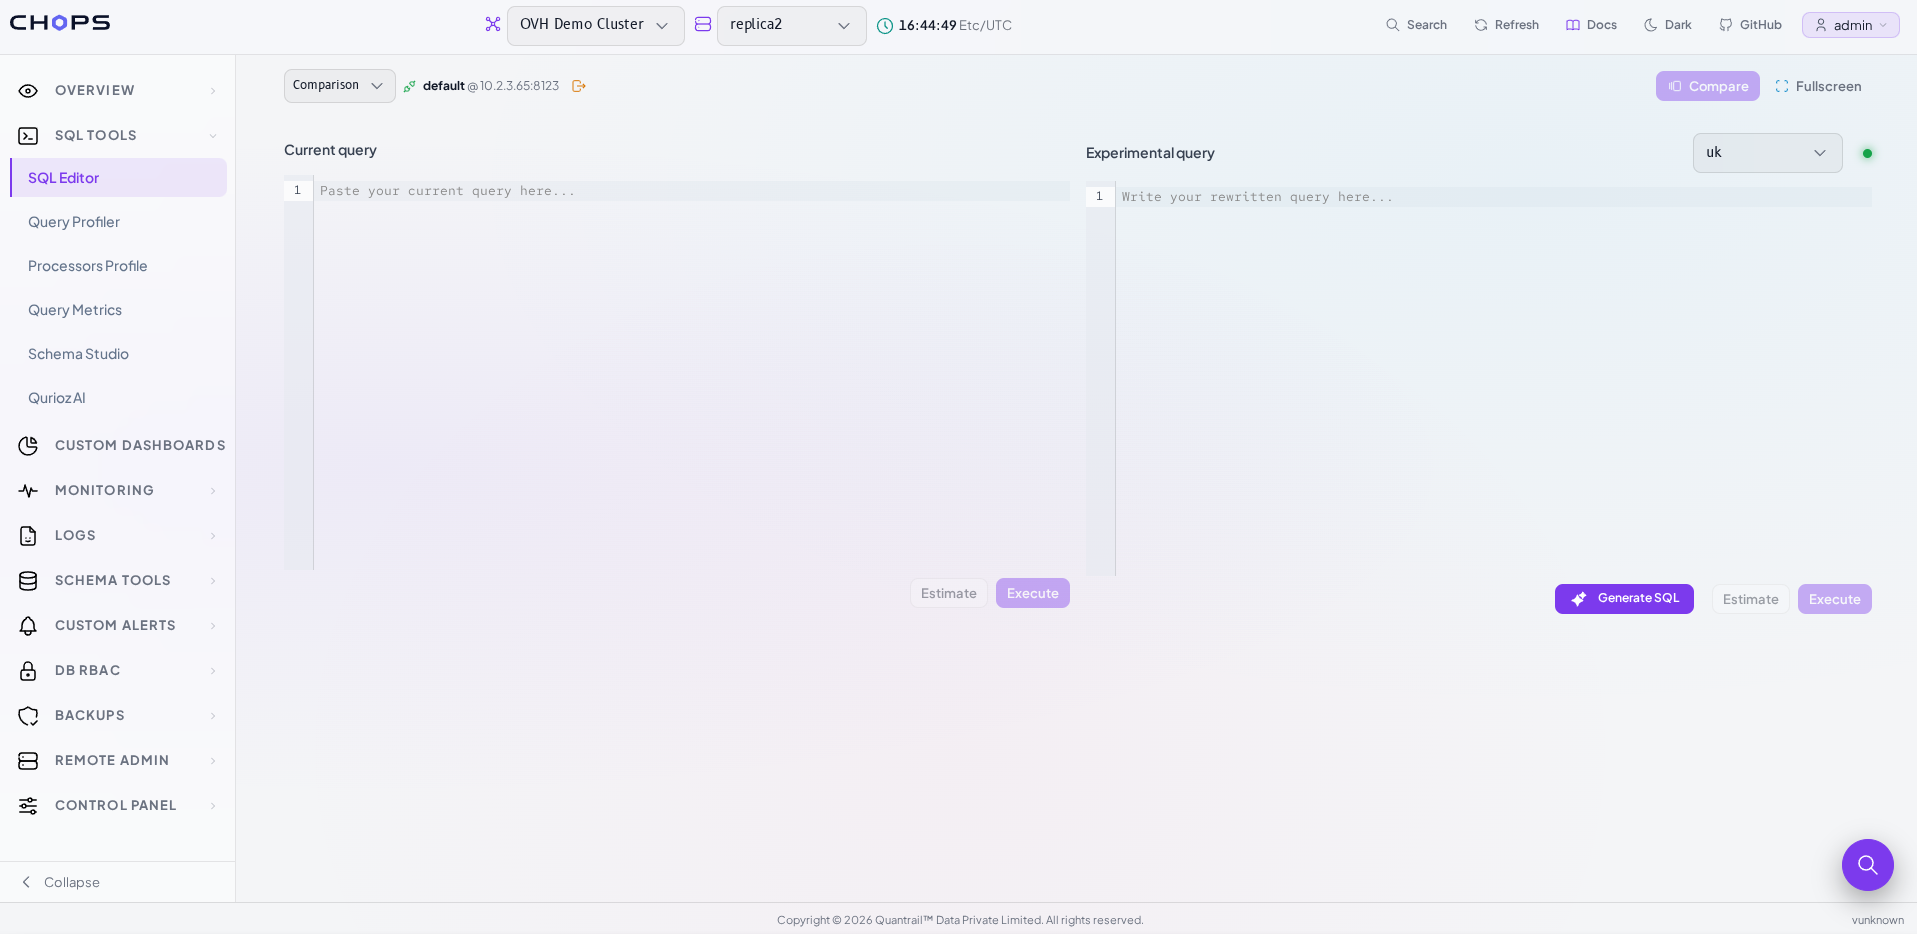 Comparison mode split-screen view
Export Option
Once your query is complete, exporting the results is just as simple.
The SQL Editor supports exporting query results in multiple formats, including: CSV, JSON, Parquet, etc. Exports are processed on the server, allowing large datasets to be generated without affecting the browser session.
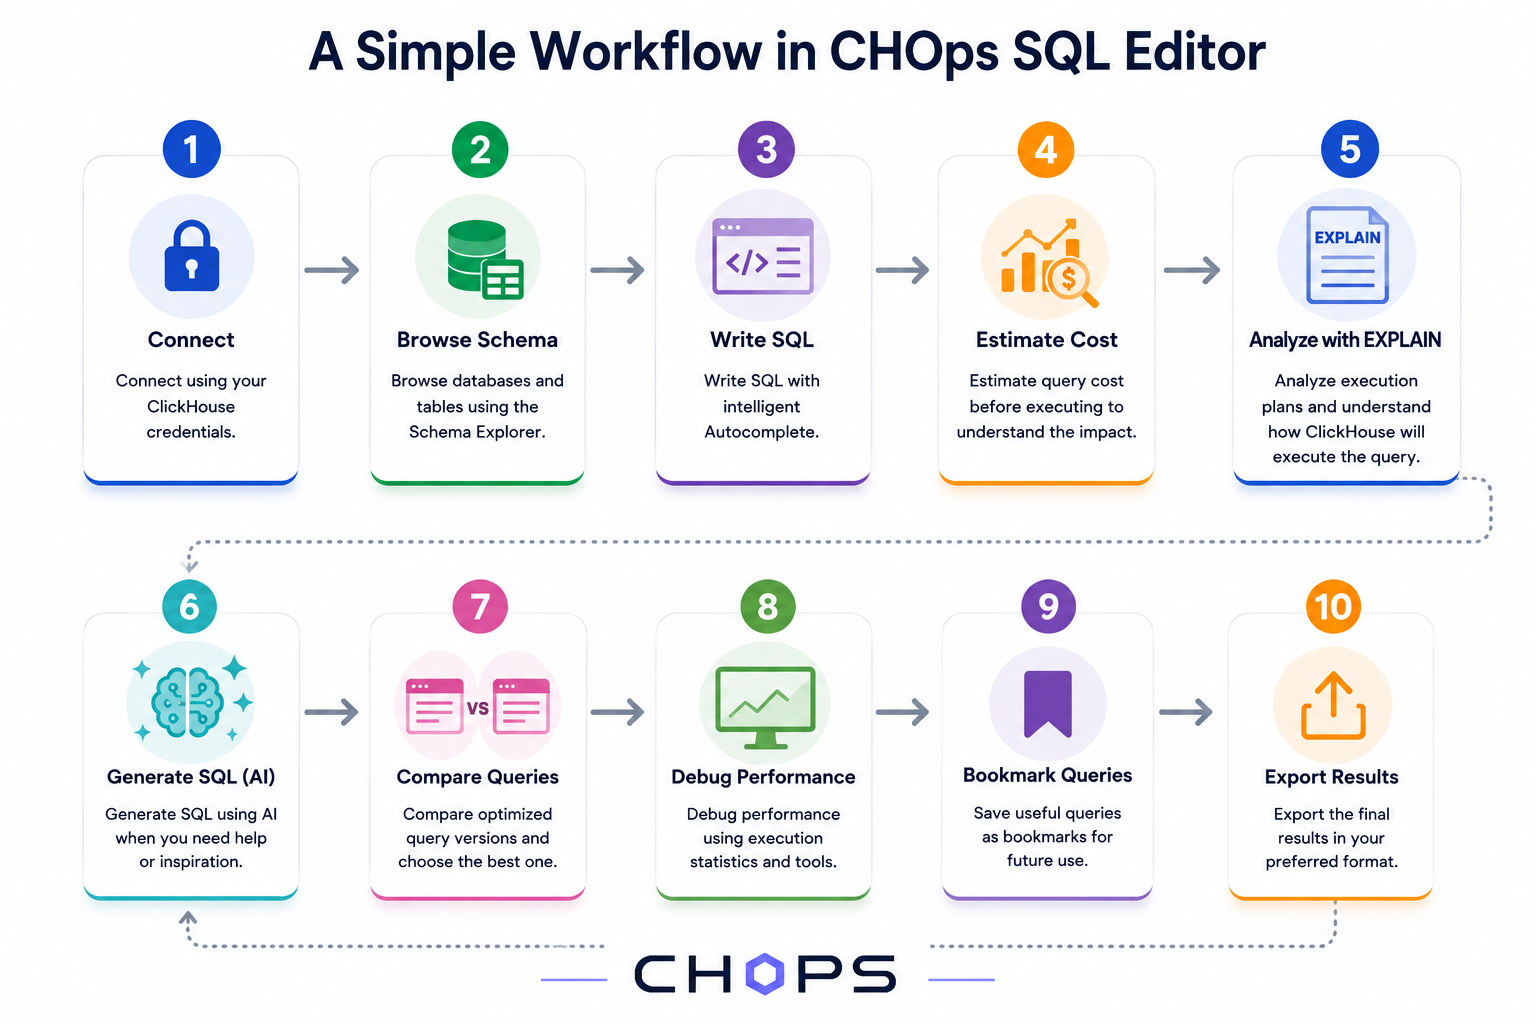
A Simple Workflow
A typical workflow inside the CHOps SQL Editor looks like this:
Conclusion
Each feature in the SQL Editor solves a small part of the query development process. Autocomplete reduces typing, EXPLAIN helps you understand execution plans, Cost estimation highlights expensive queries before execution, and Comparison Mode makes performance tuning much easier.
Individually, these features improve specific tasks. Together, they reduce context switching, simplify query optimization, and provide a smoother development experience for anyone working with ClickHouse®.
Further Reading
If you're new to CHOps or would like to explore it further, the following resources are a great place to start: