Materialized CTEs are one of the notable SQL improvements introduced in ClickHouse® 26.3. While the feature sounds promising, an important question remains:
Do Materialized CTEs actually improve query performance in real workloads?
Instead of relying on assumptions, this article benchmarks Materialized CTEs using ClickHouse® 26.3 in a reproducible Docker environment. We'll compare execution times, memory usage, and query statistics using the same dataset and identical workloads.

Test Environment
The benchmark was performed using the following environment.
| Component | Version |
|---|---|
| ClickHouse | 26.3 LTS |
| Deployment | Docker Compose |
| Dataset | The UK property prices dataset (official ClickHouse® sample dataset) |
| Client | clickhouse-client |
| Benchmark Tool | a custom bash script (run_benchmark.sh) that ran each query 11 times via clickhouse-client and pulled timing/memory/rows-read stats out of system.query_log |
Machine Specifications
- CPU: AMD Ryzen 5 3400G (4 cores / 8 threads, integrated Radeon Vega 11 Graphics)
- RAM: 16 GiB total (13.6 GiB usable)
- Storage: NVMe SSD, 465.8 GB (nvme0n1)
- Operating System: KDE neon (Ubuntu-based)
Docker Compose Configuration
Use a minimal Docker Compose setup so anyone can reproduce the benchmark.
services:
  clickhouse:
    image: clickhouse/clickhouse-server:26.3
    container_name: clickhouse-263
    ports:
      - "8123:8123"
      - "9000:9000"
    ulimits:
      nofile:
        soft: 262144
        hard: 262144
    environment:
      CLICKHOUSE_DEFAULT_ACCESS_MANAGEMENT: "1"
    volumes:
      - ch_data:/var/lib/clickhouse
      - ./users.d:/etc/clickhouse-server/users.d

volumes:
  ch_data:
Docker compose running

Enabling Materialized CTEs
Materialized CTEs are gated behind two settings in 26.3 - both are required, not just one:
SET enable_materialized_cte = 1, enable_analyzer = 1;If enable_analyzer is off, Materialized CTEs won't work at all, since the
feature only runs on ClickHouse's newer query analyzer pipeline, not the
legacy one. Rather than typing SET before every query, you can make both
defaults for every session by dropping this into users.d/:
<clickhouse>
    <profiles>
        <default>
            <enable_materialized_cte>1</enable_materialized_cte>
            <enable_analyzer>1</enable_analyzer>
        </default>
    </profiles>
</clickhouse>
Without this, the MATERIALIZED keyword is silently ignored and the query
falls back to standard CTE behavior - worth checking system.settings before
you benchmark, or you may end up comparing two identical traditional queries
without realizing it.
Preparing the Dataset
Rather than generating synthetic data, this benchmark uses one of the official datasets provided by the ClickHouse® team.
Dataset:
The UK property prices dataset
Reason for choosing it:
The dataset was imported using ClickHouse's url() table function, which streams the UK Land Registry's pp-complete.csv directly over HTTP into an INSERT ... SELECT - no manual download step required. The full ~28–30 million row import completed in 1–3 minutes depending on network speed, with column transforms (postcode splitting, enum mapping for property type/duration, date parsing) applied inline during the insert.
Benchmark Methodology
To ensure fair comparisons:
- Same ClickHouse® version
- Same dataset
- Same hardware
- Same configuration
- Same cache state
- Same query repeated multiple times
Each benchmark was executed:
- 1 warm-up run
- 10 measured runs
The reported value is the average execution time.
Test Case 1 - Simple Aggregation
Purpose:
Evaluate whether Materialized CTEs improve a straightforward analytical aggregation.
Traditional Query
WITH yearly AS
(
    SELECT toYear(date) AS year, avg(price) AS avg_price, count() AS cnt
    FROM uk.uk_price_paid
    GROUP BY year
)
SELECT * FROM yearly ORDER BY year FORMAT Null
Materialized CTE
WITH yearly AS MATERIALIZED
(
    SELECT toYear(date) AS year, avg(price) AS avg_price, count() AS cnt
    FROM uk.uk_price_paid
    GROUP BY year
)
SELECT * FROM yearly ORDER BY year FORMAT Null
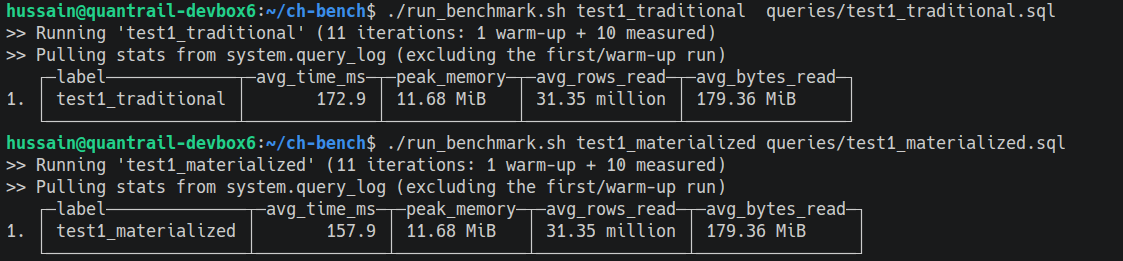
Benchmark Results
| Metric | Traditional | Materialized |
|---|---|---|
| Avg Time | 172.9 ms | 157.9 ms |
| Peak Memory | 11.68 MiB | 11.68 MiB |
| Rows Read | 31.35 million | 31.35 million |
| Bytes Read | 179.36 MiB | 179.36 MiB |
Observered :
- Improvement observed: 172.9 ms → 157.9 ms (~8.7% faster)
- Peak memory, rows read, and bytes read were identical between traditional and materialized versions
- This CTE has only one consumer (SELECT * FROM yearly), so there's no redundant computation for materialization to eliminate
- Since the underlying work is provably the same in both cases, the ~15ms gap is most likely run-to-run timing variance, not a structural win
- Worth re-running a few more times before treating 8.7% as a reliable number
Test Case 2 - Reusing the Same CTE Multiple Times
This is the scenario where Materialized CTEs are expected to provide the greatest benefit.
Traditional Query
WITH top_counties AS
(
    SELECT county, sum(price) AS total_value, count() AS deals
    FROM uk.uk_price_paid
    GROUP BY county
    ORDER BY total_value DESC
    LIMIT 50
)
SELECT 'highest_total' AS metric, county, total_value
FROM top_counties ORDER BY total_value DESC LIMIT 1
UNION ALL
SELECT 'lowest_of_top50' AS metric, county, total_value
FROM top_counties ORDER BY total_value ASC LIMIT 1
UNION ALL
SELECT 'avg_of_top50' AS metric, 'ALL' AS county, avg(total_value)
FROM top_counties
FORMAT Null
Materialized CTE
WITH top_counties AS MATERIALIZED
(
    SELECT county, sum(price) AS total_value, count() AS deals
    FROM uk.uk_price_paid
    GROUP BY county
    ORDER BY total_value DESC
    LIMIT 50
)
SELECT 'highest_total' AS metric, county, total_value
FROM top_counties ORDER BY total_value DESC LIMIT 1
UNION ALL
SELECT 'lowest_of_top50' AS metric, county, total_value
FROM top_counties ORDER BY total_value ASC LIMIT 1
UNION ALL
SELECT 'avg_of_top50' AS metric, 'ALL' AS county, avg(total_value)
FROM top_counties
FORMAT Null
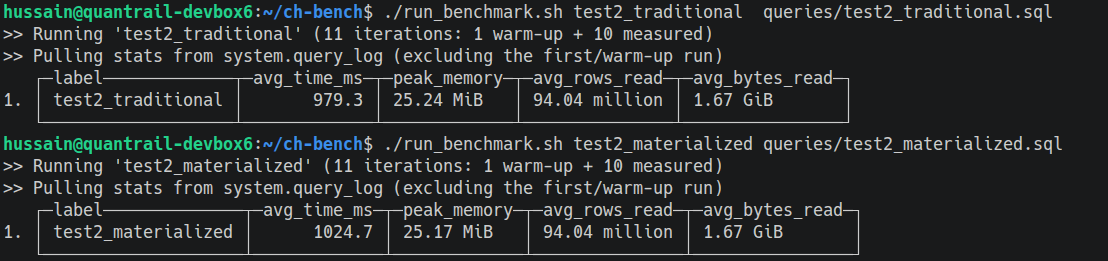
Benchmark Results
| Metric | Traditional | Materialized |
|---|---|---|
| Avg Time | 979.3 ms | 1024.7 ms |
| Peak Memory | 25.24 MiB | 25.17 MiB |
| Rows Read | 94.04 million | 94.04 million |
| Bytes Read | 1.67 GiB | 1.67 GiB |
Observed
- Result: 979.3 ms → 1024.7 ms - materialized was ~4.6% slower, not faster
- This goes against the "textbook" expectation, despite the CTE being referenced 3 times (via UNION ALL)
- Rows read and bytes read were identical in both versions (94.04M rows, 1.67 GiB) - no reduction in scan volume from materializing
- Likely cause: top_counties is a small, cheap intermediate result (only 50 rows) - the overhead of writing it to a temp table outweighs the near-negligible cost of recomputing 50 rows three times
- Takeaway: reuse count alone isn't sufficient justification for materializing - the cost of the underlying computation matters just as much
Test Case 3 - JOIN Workload
Evaluate a query where the intermediate result participates in a JOIN.
Traditional Query
WITH county_stats AS
(
    SELECT county, type, avg(price) AS avg_price
    FROM uk.uk_price_paid
    WHERE type IN ('detached', 'flat')
    GROUP BY county, type
)
SELECT
    d.county,
    d.avg_price AS detached_avg,
    f.avg_price AS flat_avg,
    d.avg_price - f.avg_price AS price_gap
FROM county_stats AS d
INNER JOIN county_stats AS f ON d.county = f.county
WHERE d.type = 'detached' AND f.type = 'flat'
ORDER BY price_gap DESC
FORMAT Null
Materialized CTE
WITH county_stats AS MATERIALIZED
(
    SELECT county, type, avg(price) AS avg_price
    FROM uk.uk_price_paid
    WHERE type IN ('detached', 'flat')
    GROUP BY county, type
)
SELECT
    d.county,
    d.avg_price AS detached_avg,
    f.avg_price AS flat_avg,
    d.avg_price - f.avg_price AS price_gap
FROM county_stats AS d
INNER JOIN county_stats AS f ON d.county = f.county
WHERE d.type = 'detached' AND f.type = 'flat'
ORDER BY price_gap DESC
FORMAT Null
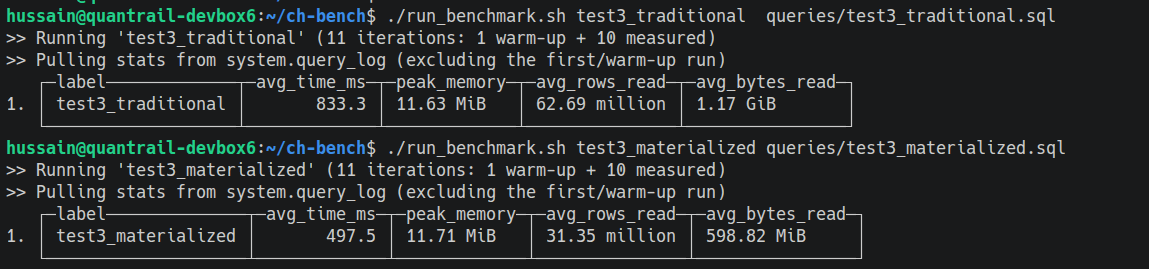
Benchmark Results
| Metric | Traditional | Materialized |
|---|---|---|
| Avg Time | 833.3 ms | 497.5 ms |
| Peak Memory | 11.63 MiB | 11.71 MiB |
| Rows Read | 62.69 million | 31.35 million |
| Bytes Read | 1.17 GiB | 598.82 MiB |
Observed
- Result: 833.3 ms → 497.5 ms - ~40.3% faster, the clearest win in the benchmark
- Rows read cut exactly in half: 62.69M → 31.35M
- Bytes read roughly halved: 1.17 GiB → 598.82 MiB
- Matches the expected mechanism precisely: traditionally, each side of the self-join (d and f) recomputed the full GROUP BY county, type aggregate independently, scanning the base table twice
- Materializing computes county_stats once, and both join sides read from the same stored result
- Strongest evidence that Materialized CTEs deliver on their promise - specifically when a CTE feeds a JOIN referencing it from both sides
Test Case 4 - Complex Expressions
Traditional Query
WITH enriched AS
(
    SELECT
        price,
        postcode1,
        extract(postcode1, '^[A-Z]+') AS postcode_area,
        upper(concat(addr1, ' ', street, ' ', town)) AS full_address,
        formatDateTime(date, '%Y-%m') AS year_month,
        length(splitByChar(' ', addr1)) AS addr_token_count
    FROM uk.uk_price_paid
)
SELECT
    postcode_area,
    year_month,
    avg(price) AS avg_price,
    count() AS cnt
FROM enriched
GROUP BY postcode_area, year_month
ORDER BY cnt DESC
FORMAT Null
Materialized CTE
WITH enriched AS MATERIALIZED
(
    SELECT
        price,
        postcode1,
        extract(postcode1, '^[A-Z]+') AS postcode_area,
        upper(concat(addr1, ' ', street, ' ', town)) AS full_address,
        formatDateTime(date, '%Y-%m') AS year_month,
        length(splitByChar(' ', addr1)) AS addr_token_count
    FROM uk.uk_price_paid
)
SELECT
    postcode_area,
    year_month,
    avg(price) AS avg_price,
    count() AS cnt
FROM enriched
GROUP BY postcode_area, year_month
ORDER BY cnt DESC
FORMAT Null
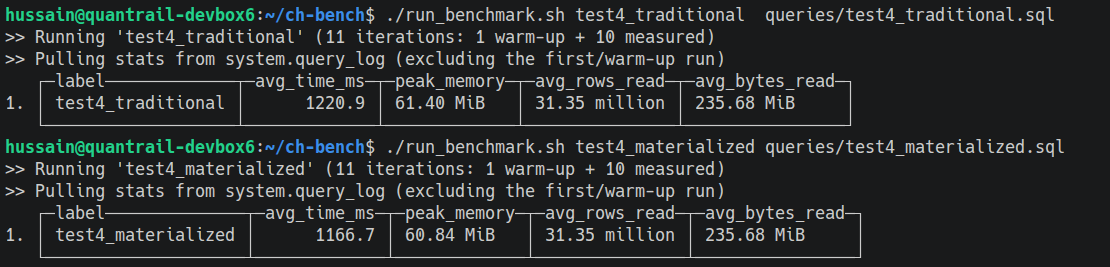
Benchmark Results
| Metric | Traditional | Materialized |
|---|---|---|
| Avg Time | 1220.9 ms | 1166.7 ms |
| Peak Memory | 61.40 MiB | 60.84 MiB |
| Rows Read | 31.35 million | 31.35 million |
| Bytes Read | 235.68 MiB | 235.68 MiB |
Observed
- Result: 1220.9 ms → 1166.7 ms - ~4.4% faster
- Memory, rows read, and bytes read all essentially unchanged between versions
- Like Test 1, this CTE has only one consumer - the expensive per-row work (regex extraction, string concatenation, date formatting) still only happens once either way
- The small gap is likely measurement noise, not a real structural benefit
- Useful contrast to Test 3: shows that per-row CPU cost alone doesn't unlock a materialization win - reuse is still the deciding factor, not row-level complexity
Overall Benchmark Summary
| Test | Traditional | Materialized | Improvement |
|---|---|---|---|
| Aggregation | 172.9 ms | 157.9 ms | +8.7% faster |
| Reused CTE | 979.3 ms | 1024.7 ms | −4.6% slower |
| JOIN | 833.3 ms | 497.5 ms | +40.3% faster |
| Complex Expressions | 1220.9 ms | 1166.7 ms | +4.4% faster |
Observations
- The clearest win was the JOIN workload (Test 3), where the CTE was scanned by both sides of a self-join - cutting rows read in half and execution time by 40%. This matches the core promise of the feature: eliminate duplicate computation when one intermediate result feeds multiple consumers.
- The "textbook" reuse case (Test 2, three references via UNION ALL) did not win - it was slightly slower, with identical rows/bytes read between versions. Reuse count alone isn't enough; the underlying computation needs to be expensive enough that avoiding a second (or third) pass is worth the cost of storing the intermediate result.
- Single-consumer cases (Tests 1 and 4) showed only small gains - rows, bytes, and memory were identical to their traditional counterparts in both cases. This is expected, not surprising: ClickHouse's own documentation confirms that when a materialized CTE is only referenced once, the engine automatically inlines it back into a regular subquery to avoid the overhead - meaning MATERIALIZED effectively becomes a no-op for single-consumer queries. The ~15ms and ~54ms gaps in Tests 1 and 4 are therefore just normal run-to-run timing noise, not a partial materialization benefit.
- Peak memory stayed essentially flat across all four tests. The common assumption that materializing always costs extra memory didn't show up in this data - worth softening that claim in the Best Practices section rather than stating it as a given.
Best Practices
Based on the benchmark:
- Use Materialized CTEs when a non-trivial computation is referenced multiple times - reuse count alone isn't sufficient (see Test 2), especially when the CTE feeds a self-join or similar multi-scan pattern (see Test 3, the clearest win in this benchmark).
- Benchmark your own workload before adopting them widely.
- Measure both execution time and memory usage.
- Keep your ClickHouse version fixed during comparisons.
- Run multiple iterations and discard the first warm-up run.
Final Thoughts
Materialized CTEs introduce a useful optimization in ClickHouse® 26.3, but like many performance features, their impact depends on workload characteristics. Through reproducible benchmarks, this article demonstrated where the feature provides measurable improvements and where the gains are minimal.
If you're considering adopting Materialized CTEs in production, benchmark them against your own workload rather than assuming they'll improve every query. Real-world testing remains the most reliable way to validate performance improvements.
For more ClickHouse optimization and operational guidance, explore the CHOps feature page at Features.