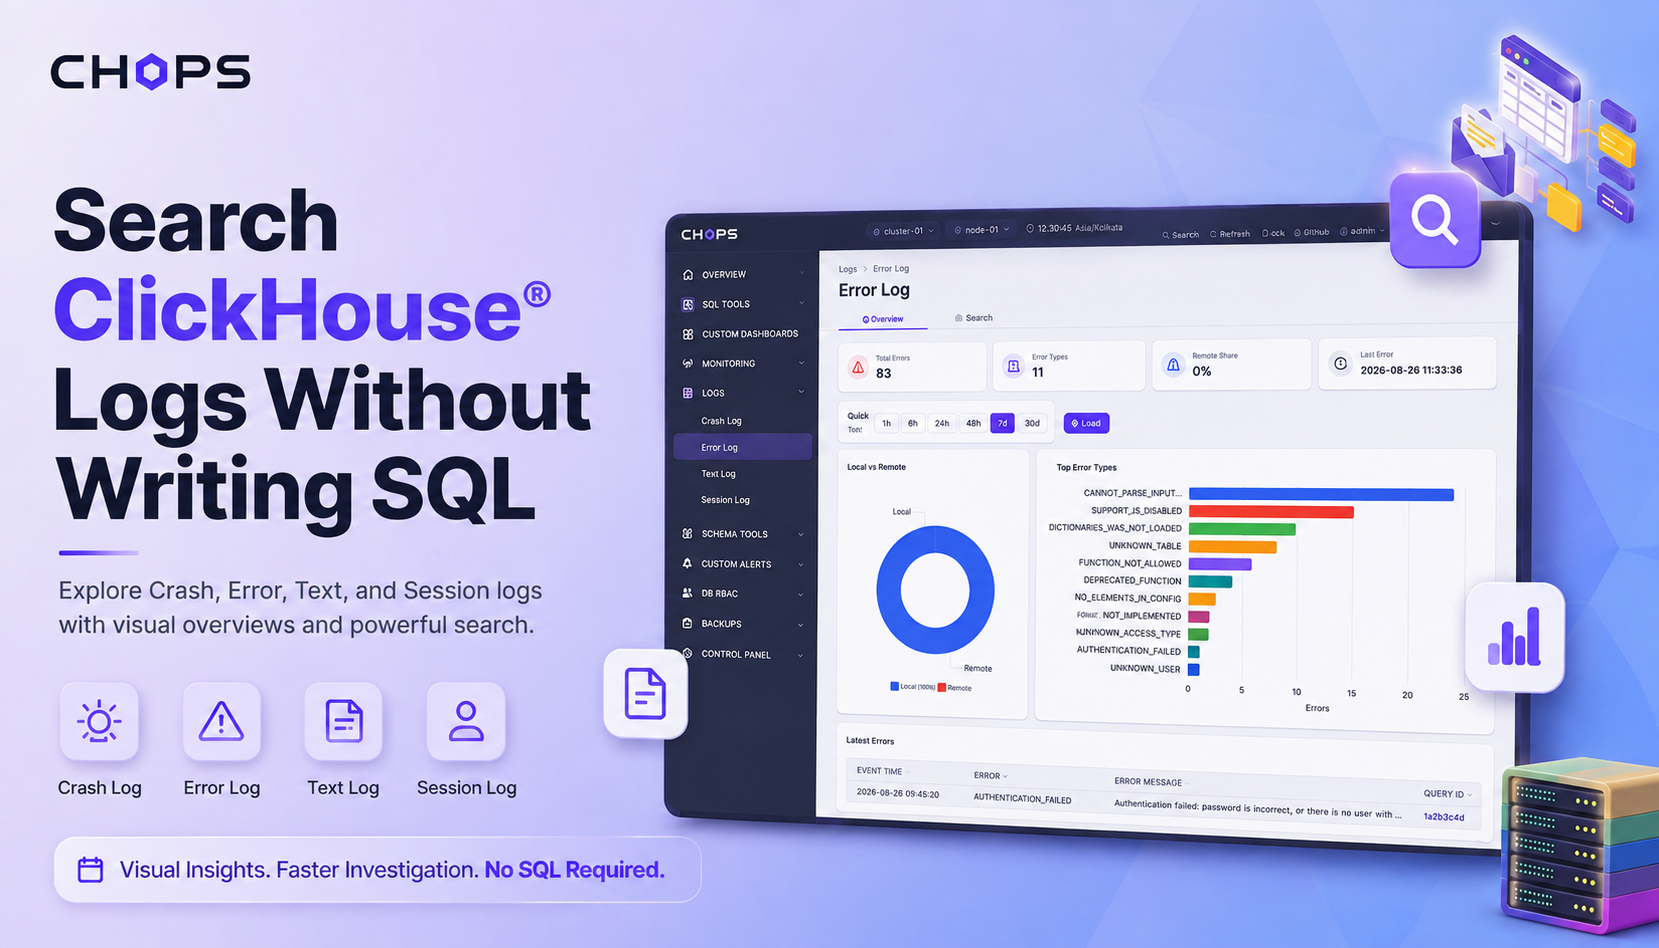
I have been on call for ClickHouse® clusters long enough to have opinions about monitoring. The main one is that most teams monitor too many things and watch none of them, when they should monitor a few things and watch them closely. This is the guide I wish I had when I started: what actually matters on a ClickHouse® cluster, and what is just noise.
The screen I check first
Every morning, and the moment a page comes in, I look at one thing: cluster health at a glance. Are all the nodes up. Is replication keeping up. Are there queries stuck. Is memory under control. The CHOps monitoring view puts these on one screen, and that screen answers ninety percent of "is everything okay" in about five seconds.
The value is not any single metric. It is having the handful that matter in one place, so you do not have to run four queries across three nodes to build the picture in your head. When you are half awake at 3am, that matters.
The metrics that actually predict trouble
After the basics, here are the ones I have learned to trust as early warnings.
Replication lag is the big one. If a replica falls behind and keeps falling, you are heading toward inconsistent reads and, eventually, a node that cannot catch up. Watching the trend matters more than the instant value. A lag of a few seconds that stays flat is fine. A lag that climbs steadily is a problem you want to catch early.
Memory usage relative to the node's limit. ClickHouse® is happy to use a lot of memory, and that is fine until a big query tips it over and queries start getting killed. I watch the headroom, not just the absolute number.
The count of parts per table. ClickHouse® merges parts in the background, and if inserts outpace merges, part counts climb. Too many parts slows everything down and eventually triggers errors. A rising part count is a quiet early sign that merges are falling behind. I wrote a whole post on monitoring merges and mutations because this one catches people out.
Query failure rate. A sudden rise in failed queries usually means something changed, a bad deploy, a schema issue, or resource pressure. It is a great canary.
What I deliberately ignore
Here is the part people find surprising. I do not watch raw CPU very closely. ClickHouse® is designed to use all the CPU you give it during a query, so high CPU is often just the database doing its job fast. CPU only matters to me in context, alongside query latency and queue depth.
I also do not alert on every transient blip. A single slow query at 2am that recovered on its own does not need to wake anyone. Monitoring everything and alerting on everything is how teams end up ignoring all of it. I cover the alerting side of this in ClickHouse email alerts.
Make it visual, make it shared
The other lesson is that monitoring only works if the team can see it. Knowledge that lives in one engineer's saved queries is not monitoring, it is a bus factor. Putting the key metrics on shared dashboards, and the cluster health on one screen everyone can open, is what turns monitoring from a personal habit into a team capability.
ClickHouse® also lets you build monitoring out of its own system tables, which means you can watch anything you can write a query for. I covered that in custom monitoring dashboards. The combination of a standard health view plus a few custom panels for your specific workload is, in my experience, the setup that actually gets watched.
The short version
Watch node status, replication lag, memory headroom, part counts, and query failure rate. Put them on one screen. Do not drown in CPU graphs or alert on every blip. That is monitoring that earns its keep rather than monitoring that everyone learns to ignore. The monitoring feature page shows how the health view and custom dashboards fit together.
Monitoring databases is a technical topic, and the right setup depends on your workload. Treat the list above as a starting point and tune it to what your cluster actually does.